0
$\begingroup$

My data looks like the following: enter image description here

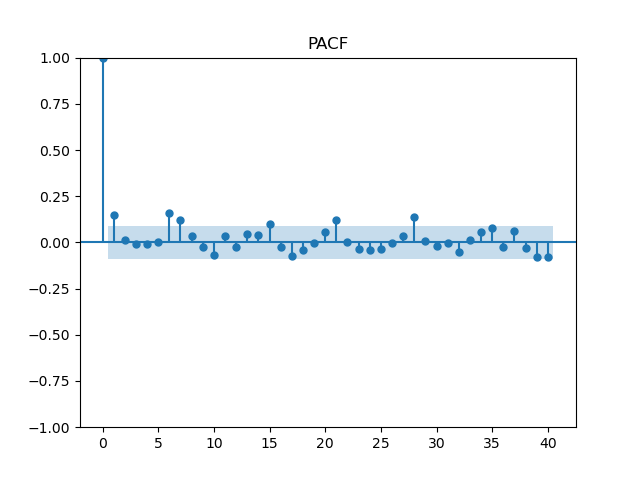
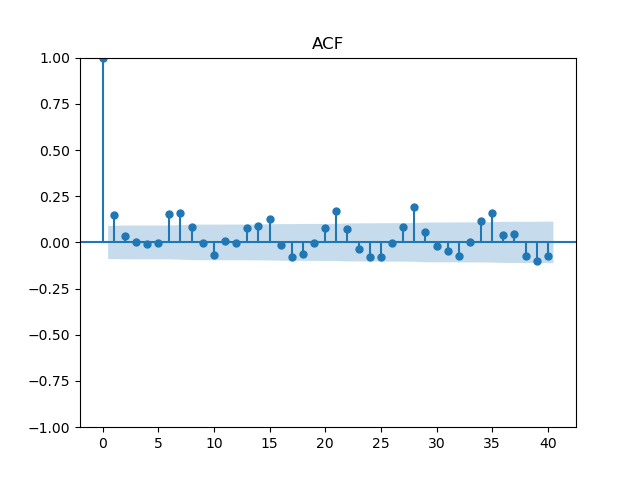
The ACF and PACF plots look like the following: enter image description here
enter image description here

Although there is some dependence with some lags, I fear taking these too seriously is a form of overfitting. I don't need perfect predictions but an approximate. A moving average could work I guess but I was wondering if anyone has an idea of what type of model is applicable here.

To me it seems like "random" peaks that are not at all predictable.

$\endgroup$
2
  • $\begingroup$ Might one strategy be to consider some of the large observations as outliers? Then there is quite a cyclical pattern. $\endgroup$
    – sir.edward
    Commented Aug 16 at 18:37
  • 1
    $\begingroup$ Is the data nonnegative or perhaps positive? If the latter, perhaps some transformation from the positive half of the real line to the entire real line would make it more suitable for an ARIMA model? $\endgroup$ Commented Aug 17 at 17:23

0

Your Answer

By clicking “Post Your Answer”, you agree to our terms of service and acknowledge you have read our privacy policy.