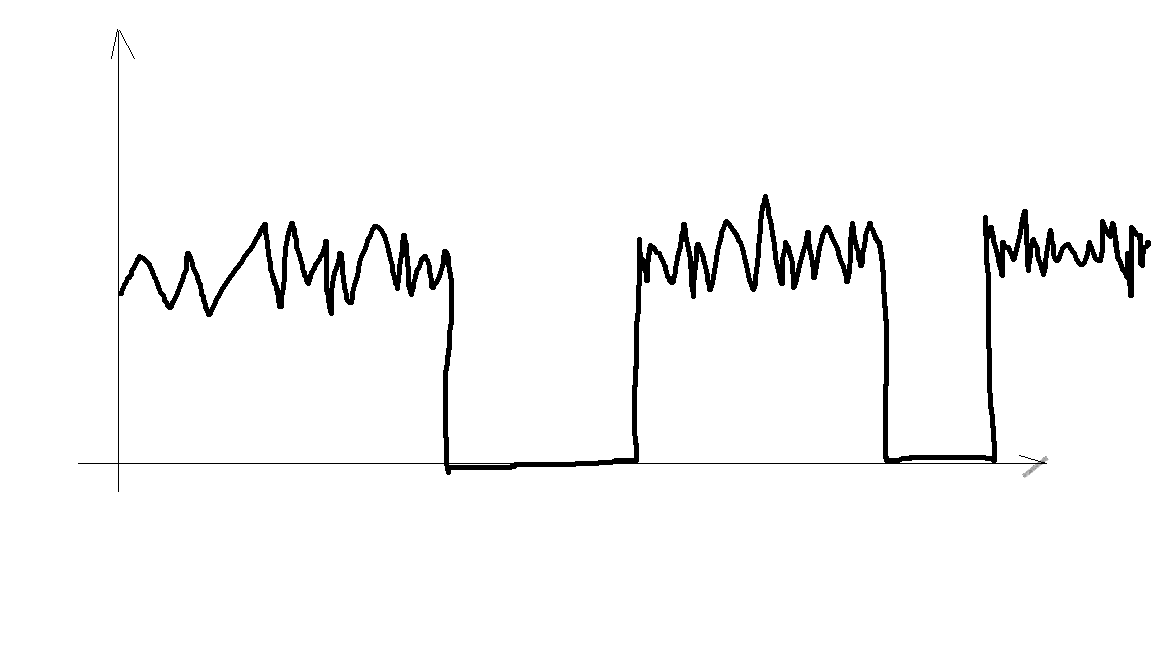
A Markov switching model could probably capture this well. In a Markov switching model, parameters can shift between two or more regimes. The switching can occur in all parameters, or just in a subset. According to your drawing, it looks like the mean and variance both increase and decrease together. For example,
$$ \begin{align*}
y_t &= \mu_{St} + \varepsilon_{t} \\
\mu_{St} &= \left \{ \begin{matrix} \mu_1 & \text{if} & S_t=1 \\ \mu_2 & \text{if} & S_t=2\end{matrix} \right . \\
\varepsilon_t &\sim \left \{ \begin{matrix} N(0,\sigma_1^2)& \text{if} & S_t=1 \\ N(0,\sigma_2^2) & \text{if} & S_t=2\end{matrix} \right . \\
p(S_t=1|S_{t-1}=1) &= p_{11} \\
p(S_t=2|S_{t-1}=2) &= p_{22} \\
\end{align*} $$
The transition probabilities, from one regime to the other (e.g., $p_{11}$), can be assumed constant (e.g. if the process is in regime 1, there is always a 5% probability of switching to regime 2), or they can be modeled as depending on covariates.
You could also model the mean and variance as following two separate regimes.
Some practical issues - first, MS models can struggle if your data has outliers. For example, fitting a two-regime model to Real GDP growth used to find recession and expansion periods. Fitting one now, with the presence of the massive COVID outliers, it just finds the outlier periods. So you would need to directly model the outliers or censor your data. Second, MS models tend not to forecast very well. Take again Real GDP growth as an example - a simple AR(1) or AR(2) model will usually be very competitive with or even forecast better than forecasts from a MS model.
This is a great reference text on MS models: https://direct.mit.edu/books/monograph/3265/State-Space-Models-with-Regime-SwitchingClassical
And it looks like there are a few R/Python packages that can fit these types of models. One example is here: https://cran.r-project.org/web/packages/MSwM/vignettes/examples.pdf


strucchange,changepoint, andecppackages in R and the ruptures package in Python. My own R and Python package Rbeast provides a Bayesian way, though no intended for forecasting, it can be twisted a little bit for prediction. $\endgroup$