8
$\begingroup$

I am doing a regression analysis of environmental data, and I encounter some rather specific relationships between my predictors and the response variable. I am doubtful that a simple linear regression would suffice here. One option I thought of is quantile regression, but I would be happy to hear some of your thoughts.

Here are two examples:

enter image description here enter image description here

As you can see, there is definitely some relationship, but it is not exactly linear…

$\endgroup$
6
  • $\begingroup$ Can you tell us what the variables represent? $\endgroup$ Commented Aug 29 at 9:54
  • $\begingroup$ @kjetil-b-halvorsen not to go into too much detail, the y variable is the rate of recovery of vegetation after a disturbance (here in % after 30 years), and the predictors here include distance to the edge of disturbed area (which may mean higher disturbance rate, but also closeness to seed sources which would stimulate regrowth), as well as mean summer temperatures (regrowth would be higher in warmer summer conditions) $\endgroup$ Commented Aug 29 at 10:06
  • 4
    $\begingroup$ I am usually a fan of quantile reg, but I don't think it's what you want here. You might look into variance function regression. See Western & Bloome Variance Function Regression for Measuring Inequality in Sociological Methodology which includes code in BUGS and Stata. (The BUGS code looks like it could be translated to R without too much trouble). $\endgroup$
    – Peter Flom
    Commented Aug 29 at 10:08
  • 1
    $\begingroup$ +1 for quantile regression to be honest what else can you achieve given these patterns? Assuming hetroscedasticity will allow you to fit variance and mean, but this just translates indirectly to something similar like quantile regression ( not technically, but when you interpret the results the information content will be similar) $\endgroup$
    – Ggjj11
    Commented Aug 29 at 13:17
  • $\begingroup$ A scatter by itself in this case could mislead the data, instead you should make scatter matrix graphs, density, histogram or even a box plot. $\endgroup$ Commented Aug 30 at 18:18

1 Answer 1

10
$\begingroup$

(Generalized Additive Models for Location Scale and Shape) can help you model any underlying nonlinearities while also accounting for the changes in distribution.

The original paper's abstract describes it well:

A general class of statistical models for a univariate response variable is presented which we call the generalized additive model for location, scale and shape (GAMLSS). The model assumes independent observations of the response variable y given the parameters, the explanatory variables and the values of the random effects. The distribution for the response variable in the GAMLSS can be selected from a very general family of distributions including highly skew or kurtotic continuous and discrete distributions. The systematic part of the model is expanded to allow modelling not only of the mean (or location) but also of the other parameters of the distribution of y, as parametric and/or additive nonparametric (smooth) functions of explanatory variables and/or random-effects terms. Maximum (penalized) likelihood estimation is used to fit the (non)parametric models. A Newton–Raphson or Fisher scoring algorithm is used to maximize the (penalized) likelihood. The additive terms in the model are fitted by using a backfitting algorithm. Censored data are easily incorporated into the framework. Five data sets from different fields of application are analysed to emphasize the generality of the GAMLSS class of models.

And its first figure illustrates its utility in your case:
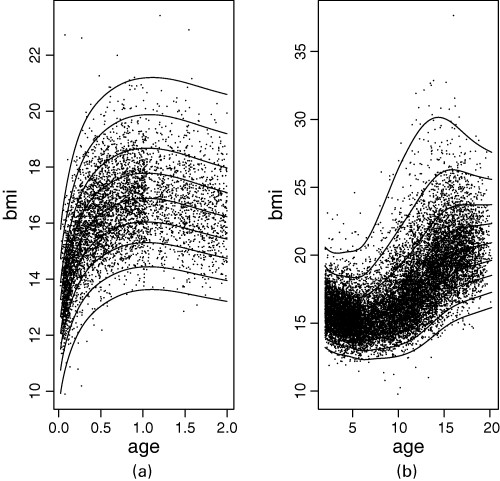
Fig 1. in Rigby & Stasinopoulos

There is an R package by the same authors and a dedicated website that has tutorials such as this one.

Refs:

Rigby, R. A., & Stasinopoulos, D. M. (2005). Generalized additive models for location, scale and shape. Journal of the Royal Statistical Society Series C: Applied Statistics, 54(3), 507-554. https://doi.org/10.1111/j.1467-9876.2005.00510.x

Stasinopoulos, D. M., & Rigby, R. A. (2007). Generalized Additive Models for Location Scale and Shape (GAMLSS) in R. Journal of Statistical Software, 23(7), 1–46. https://doi.org/10.18637/jss.v023.i07

$\endgroup$
2
  • $\begingroup$ Thank you, will try it out! Need to read more about its suitability for estimating predictor importance, as this is my main goal. $\endgroup$ Commented Aug 29 at 10:47
  • 2
    $\begingroup$ @OlegZheleznyy I have not thought about GAMLSS and importance together, but importance is a complex topic and I would encourage you to read more about the different ways it can be conceptualised and calculated. $\endgroup$
    – mkt
    Commented Aug 29 at 10:50

Your Answer

By clicking “Post Your Answer”, you agree to our terms of service and acknowledge you have read our privacy policy.

Not the answer you're looking for? Browse other questions tagged or ask your own question.