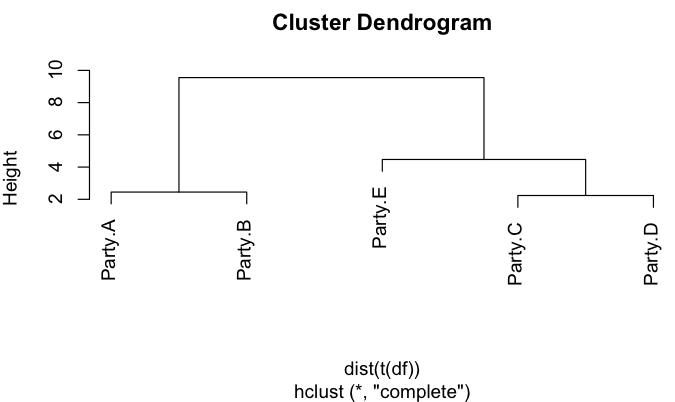
I'm working on a project where I want to sort political parties into two groups. I want to do so using the answers of many respondents in a survey who indicated for each party where they see them on a left-right scale. I used k-means clustering for my data and got working results that are also very plausible. However, seeing that I'm new to clustering approaches of any kind and I haven't found any examples online that deal with a similar data structure in their clustering, I want to make sure I'm doing the right thing. So, my questions are:
- Is the approach below a valid way of dealing with my data format?
- I'm as of now using two clusters, which is what I want but I also want to make sure that I'm not totally off in forcing parties into clusters they don't fit in. Is there a way to validate the number of clusters after the fact? I'm familiar with elbow plots and other methods to estimate the ideal number of clusters, but I'm instead looking for a way to evaluate/grade the clustering that I have already done.
# Party Dataset
df <- data.frame("Party A" = c(2,3,4,3,3),
                              "Party B" = c(3,3,4,5,4),
                              "Party C" = c(4,5,6,7,6),
                              "Party D" = c(5,6,7,8,7),
                              "Party E" = c(6,7,8,NA,8))

# Transpose Dataframe
df <- as.data.frame(t(df)) %>%
   mutate_all(as.numeric)

# Locate all missings
ind <- which(is.na(df), arr.ind=TRUE)
# Replace with Row Means
df[ind] <- rowMeans(df,  na.rm = TRUE)[ind[,1]]

# Remove empty rows
df <- na.omit(df)

# Scale
df <- scale(df)

# Remove cases with missing values in scaled data
t <- t[,colSums(is.na(t))<nrow(t)]

# Cluster using 2 kmeans centers
km.res <- kmeans(df, 2, nstart = 25)

