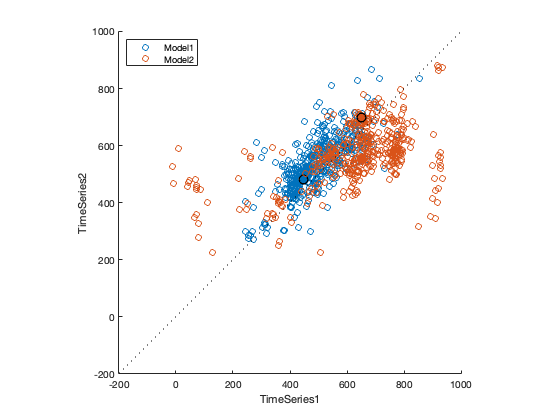
TL;DR: Are the blue and orange bootstrapped distributions in the plot different? And what is the directionality of that difference?
I'm analyzing two sets of multivariate time series using something like a cross-correlation approach. (Adapted from Seibold & McPhee 1979 and Hebart et al. 2018) At each pair of time points, the analysis isolates the shared contribution of two hypothesized models, Model1 and Model2. This yields a 2d space of significant time point clusters for Model1 and Model2. In the scatterplot below:
- X and Y axes represent each time series.
- The 2 black-edged blue and orange filled circles, just above the diagonal at about (450, 475) and (650, 675), are the observed centroids of Model1 and Model2 clusters.
- The many open circles are bootstrapped centroids computed via resampling the 12 paired time-series ~500 times.
- The underlying data comprise 12 subjects from which paired time-series were extracted, averaged, and analyzed to obtain a cluster for Model1 and Model2. The bootstrapping entails resampling the 12-subject sample.
I'd like to evaluate whether the centroids are different from each other, preferably with a metric that accounts for directionality. In addition, I'd like to evaluate whether the clusters tend toward one side or other of the diagonal. (The interpretation would be that a model describes one time series before the other time series, rather than concurrently.) For example, the blue in the scatterplot "tends" toward above the diagonal.
In the familiar 1d case, I'd check, e.g., whether >97.5% of the bootstrapped (Model2-Model1) difference scores are positive. In the 2d case, the distances arise in the x-y plane; thus, projecting the analysis to one axis or onto the diagonal sacrifices useful signal. Computing Euclidean distance for each bootstrap ignores the relative positions of the centroids, so distances can never be negative (or even zero, given noise). Kolmogorov-Smirnov and sign-tests easily distinguish the distributions but assume independence of the samples, which a bootstrapped sample violates. I am not sure how to evaluate 2-d Mahalanobis distance between distributions against chance in this context. Am I missing an appropriate sensitive measure or am I SOL statistically? Thank you.

