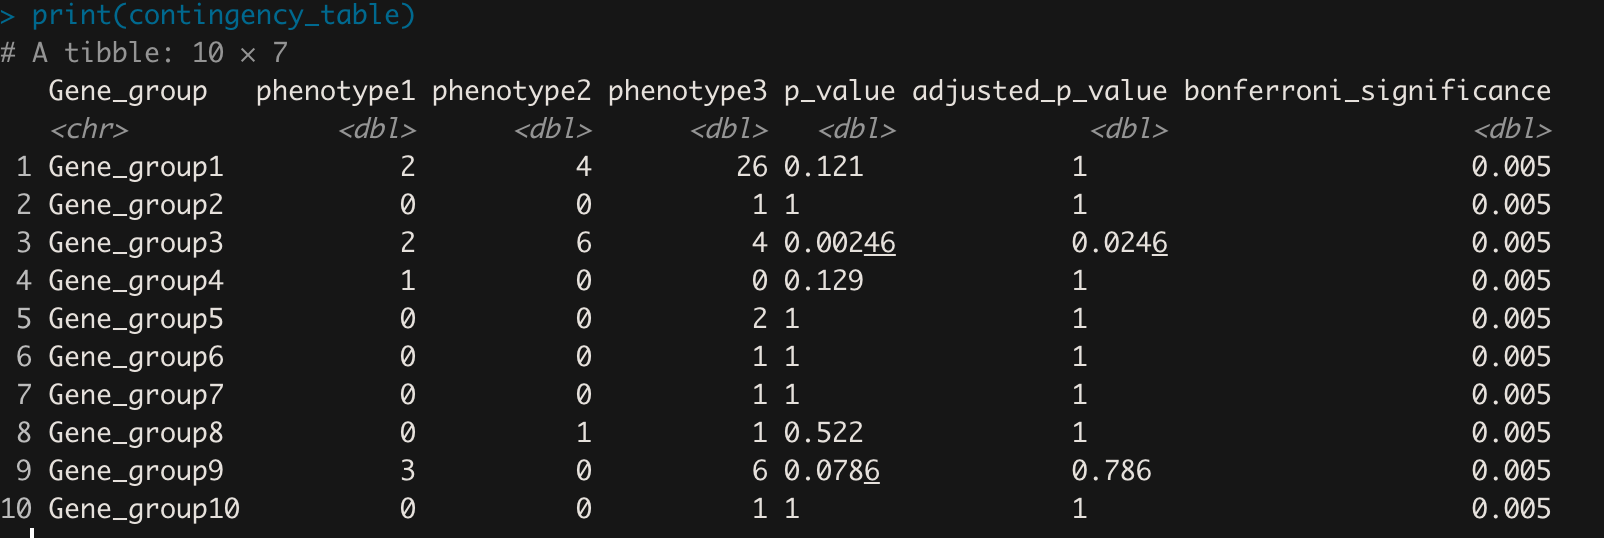
This is my contingency_table:
Gene_group  phenotype1  phenotype2  phenotype3
Gene_group1 2   4   26
Gene_group2 0   0   1
Gene_group3 2   6   4
Gene_group4 1   0   0
Gene_group5 0   0   2
Gene_group6 0   0   1
Gene_group7 0   0   1
Gene_group8 0   1   1
Gene_group9 3   0   6
Gene_group10    0   0   1
I want to identify gene groups that are significantly enriched in one phenotype over the other two individual phenotypes.
To do this, I want to see if the distribution of phenotypes in each gene group differs significantly from the distribution in the remaining ST groups. I then want to see if phenotype1 or phenotype3 is associated with a specific ST group.
Am I right in thinking that I need to run a Fisher's exact test, in a row wise manner, using a 3x2 matrix for each gene group? For each gene group I want to add a new column for the p-value. Do I then need an additional column for the multiple testing corrected p-value perhaps using the Bonferroni correction?
When i say 3x2 matrix, I think each gene group's data can be represented in a 3x2 matrix format, where:
- Columns: Represent the three phenotype categories (phenotype1, phenotype2, phenotype3)
- Rows: Two rows represent the counts for the gene group being tested and the counts for the remaining gene groups.
To do this I've tried the following:
# Load library
library(dplyr)

# Create contingency table as a data frame
contingency_table <- data.frame(
  Gene_group = c("Gene_group1", "Gene_group2", "Gene_group3", "Gene_group4", "Gene_group5", "Gene_group6", "Gene_group7", "Gene_group8", "Gene_group9", "Gene_group10"),
  phenotype1 = c(2, 0, 2, 1, 0, 0, 0, 0, 3, 0),
  phenotype2 = c(4, 0, 6, 0, 0, 0, 0, 1, 0, 0),
  phenotype3 = c(26, 1, 4, 0, 2, 1, 1, 1, 6, 1)
)

# Function to run Fisher's exact test for each Gene group
run_fisher_test <- function(gene_group_row, total_counts) {
  # Extract the counts for the current Gene group
  current_counts <- as.numeric(gene_group_row[2:4])

  # Counts for the remaining groups
  remaining_counts <- colSums(total_counts[-which(total_counts$Gene_group == gene_group_row$Gene_group), 2:4])

  # Create the contingency table
  contingency_matrix <- rbind(current_counts, remaining_counts)

  # Run Fisher's exact test
  test_result <- fisher.test(contingency_matrix)

  return(test_result$p.value)
}

# Apply the function to each row of the contingency table
contingency_table <- contingency_table %>%
  rowwise() %>%
  mutate(p_value = run_fisher_test(cur_data(), contingency_table)) %>%
  ungroup()  # Ungroup after rowwise operations

# Total number of tests
num_tests <- nrow(contingency_table)

# Adjust p-values using Bonferroni correction
contingency_table <- contingency_table %>%
  mutate(adjusted_p_value = p.adjust(p_value, method = "bonferroni")) %>%
  mutate(bonferroni_significance = 0.05 / num_tests)  # Calculate the Bonferroni significance level

# View the results
print(contingency_table)
The results look like this:
Does all of this sounds like the correct method?
I then also want to run a 2 x 2 Fishers exact test to look at gene groups significantly enriched in either phenotype1 or phenotype3, adding the p-value and multiple testing corrected p-value to additional columns for each gene group.
I'm new to coding in R, so any advice would be very helpful please.

