2
$\begingroup$

This is my contingency_table:

Gene_group  phenotype1  phenotype2  phenotype3
Gene_group1 2   4   26
Gene_group2 0   0   1
Gene_group3 2   6   4
Gene_group4 1   0   0
Gene_group5 0   0   2
Gene_group6 0   0   1
Gene_group7 0   0   1
Gene_group8 0   1   1
Gene_group9 3   0   6
Gene_group10    0   0   1

I want to identify gene groups that are significantly enriched in one phenotype over the other two individual phenotypes. Am I right in thinking that I need to run a Fisher's exact test, in a row wise manner, using a 3x2 matrix for each gene group? For each gene group I want to add a new column for the p-value. Do I then need an additional column for the multiple testing corrected p-value perhaps using the Bonferroni correction?

When I say 3x2 matrix, I think each gene group's data can be represented in a 3x2 matrix format, where:

  • Columns: Represent the three phenotype categories (phenotype1, phenotype2, phenotype3)
  • Rows: Two rows represent the counts for the gene group being tested and the counts for the remaining gene groups.

To do this I've tried the following:

# Load library
library(dplyr)

# Create contingency table as a data frame
contingency_table <- data.frame(
  Gene_group = c("Gene_group1", "Gene_group2", "Gene_group3",  
 "Gene_group4", "Gene_group5", "Gene_group6", "Gene_group7", 
 "Gene_group8", "Gene_group9", "Gene_group10"),
  phenotype1 = c(2, 0, 2, 1, 0, 0, 0, 0, 3, 0),
  phenotype2 = c(4, 0, 6, 0, 0, 0, 0, 1, 0, 0),
  phenotype3 = c(26, 1, 4, 0, 2, 1, 1, 1, 6, 1)
)

# Function to run Fisher's exact test for each Gene group
run_fisher_test <- function(gene_group_row, total_counts) {
  # Extract the counts for the current ST group
  current_counts <- as.numeric(gene_group_row[2:4])
  
  # Counts for the remaining groups
  remaining_counts <- 
      colSums(total_counts[-which(total_counts$Gene_group == 
          gene_group_row$Gene_group), 2:4])
  
  # Create the contingency table
  contingency_matrix <- rbind(current_counts, remaining_counts)
  
  # Run Fisher's exact test
  test_result <- fisher.test(contingency_matrix)
  
  return(test_result$p.value)
}

# Apply the function to each row of the contingency table
contingency_table <- contingency_table %>%
  rowwise() %>%
  mutate(p_value = run_fisher_test(cur_data(), contingency_table)) %>%
  ungroup()  # Ungroup after rowwise operations

# Total number of tests
num_tests <- nrow(contingency_table)

# Adjust p-values using Bonferroni correction
contingency_table <- contingency_table %>%
  mutate(adjusted_p_value = 
     p.adjust(p_value, method = "bonferroni")) %>%
  mutate(bonferroni_significance = 0.05 / num_tests)  
 # Calculate the Bonferroni significance level

# View the results
print(contingency_table)

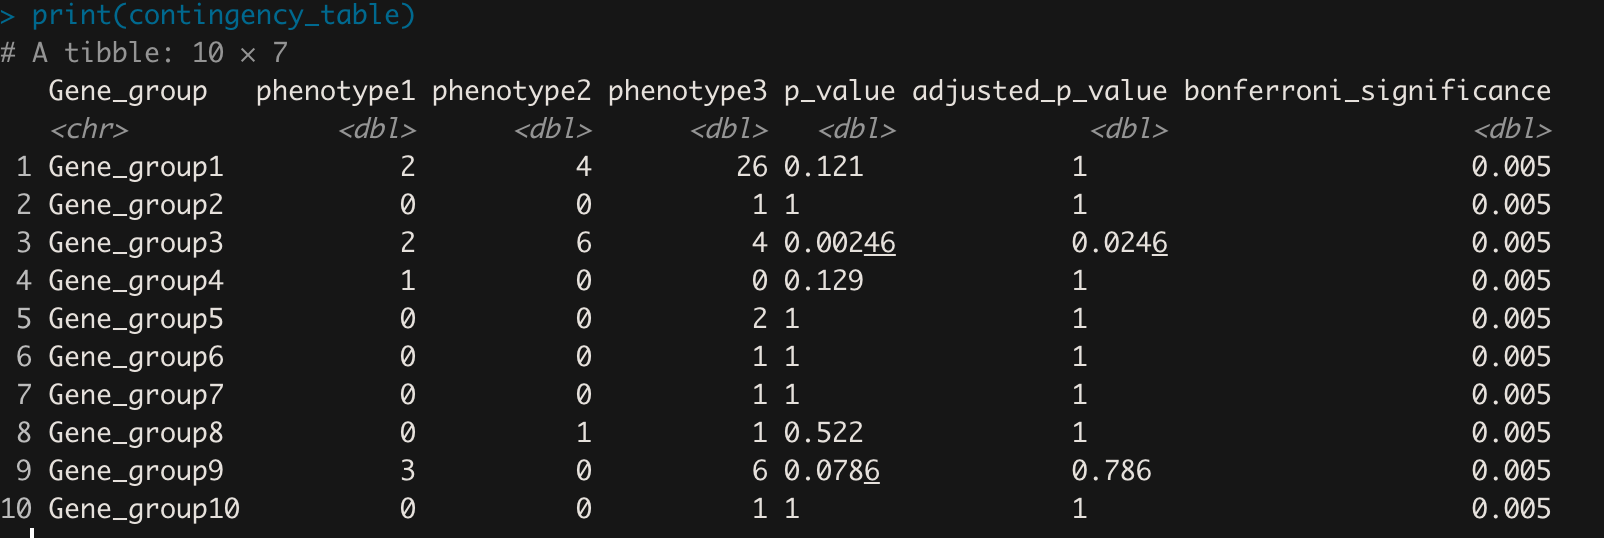
The results look like this:

enter image description here

Does all of this sounds like the correct method?

I then also want to run a 2 x 2 Fishers exact test to look at gene groups significantly enriched in either phenotype1 or phenotype3, adding the p-value and multiple testing corrected p-value to additional columns for each gene group.

I'm new to coding in R, so any advice would be very helpful please.

$\endgroup$
4
  • 1
    $\begingroup$ Note that statiatical analysis of data in contingency tables can have many different approaches depending on the type of experiment. What sort of counts or measurements are these numbers representing? Like you measure several individuals of a specific phenotype and determine whether they have gene groups yes/no? Or you measure one single individual from each specific phenotype and determine the number of genes from these gene groups? Do the totals have any meaning? Like does phenotype 1 have in total 2+2+1+3 = 7 genes or does it have many more? $\endgroup$ Commented Oct 1 at 8:34
  • 1
    $\begingroup$ What does over-enrichment mean? Phenotype 3 has in absolute terms the most counts in gene group 9, but in relative terms Phenotype 1 has 43% of it's genes in gene group 9. Which is the most enriched? $\endgroup$ Commented Oct 1 at 8:46
  • $\begingroup$ What sort of statistical variations are considered. What is the random process causing the counts to fluctuate per experiment? Is it like different individuals with phenotype 1 might have different genes? What sort of random distribution do you consider for the counts. Like, if you measure xy chromosomes in humans for male versus female phenotypes, then you would get table that is very close to $$\begin{array}{} &X&Y \\ male &1&1 \\ female & 2 & 0\end{array}$$ and the statistical deviations are not like randomness in counts as if it is a Poisson or binomial distribution. $\endgroup$ Commented Oct 1 at 8:57
  • $\begingroup$ Related question to the last comment: Statistical inference when the sample "is" the population $\endgroup$ Commented Oct 1 at 9:01

2 Answers 2

0
$\begingroup$

For testing whether any phenotype is overrepresented in a gene set, we can―as you have noted―do a Fisher's exact test on a $3\times2$ matrix.

Example for first row:

> m
           DE non_DE
phenotype1  2      6
phenotype2  4      7
phenotype3 26     17

> fisher.test(m)$p.value
[1] 0.1211639

Using a reference phenotype, here phenotype2, we want to make comparisons with the other phenotypes one after another, i.e.:

           DE non_DE
phenotype1  2      6
phenotype2  4      7

and

           DE non_DE
phenotype3 26     17
phenotype2  4      7

To combine the $\text{p}$ values of the corresponding exact Fisher tests appropriately, we can use Fisher's Combined Probability Test [1].

$$ \chi^2 = -2 \sum_{i=1}^{k} \log(p_i) $$

The combined $\text{p}$ value is obtained by comparing the test statistic to the chi-square distribution:

$$ p = 1 - F_{\chi^2}( \chi^2 \mid df = 2k ) $$

Accordingly, we can create a function that outputs $\text{p}$ values for either overall comparisons or comparisons against a specific reference phenotype, depending on an argument that we set. We use Benjamini-Hochberg (BH) [2] correction aka false discovery rate (FDR) to adjust the $p$ values. BH is recommended because it reduces Type II errors compared to Bonferroni, making it more suitable for high-dimensional data like in genomics:

> over <- \(x, total_pheno=colSums(de_counts), ref=NULL, ...) {
+   if (is.null(ref)) {
+     m <- matrix(c(x, total_pheno - x), length(x))
+     fisher.test(m, ...)$p.value
+   } else {
+     comp <- setdiff(seq_along(x), ref)
+     p <- vapply(comp, \(cp) {
+       m <- matrix(c(x[cp], x[ref], 
+                     total_pheno[cp] - x[cp], 
+                     total_pheno[ref]- x[ref]), 2)
+       fisher.test(m, ...)$p.value
+     }, FUN.VALUE=numeric(1L))
+     1 - pchisq(sum(-2*log(p)), 2*length(p))
+   }
+ }

The , ... is thought to pass additional arguments like hybrid=TRUE, simulate.p.value=TRUE, etc. to fisher.test() if desired.

Illustration for first row:

> over(de_counts[1, ], colSums(de_counts))  ## overall
[1] 0.1211639
> over(de_counts[1, ], colSums(de_counts), ref=2)  ## phenotype2 as reference
[1] 0.4992246

Overrepresentation analysis:

> ## actual comparisons:
> p_all <- apply(de_counts, 1, over, colSums(de_counts))
> p_ref2 <- apply(de_counts, 1, over, colSums(de_counts), ref=2)
> res <- cbind(de_counts,
+              p_all, p_all_fdr=p.adjust(p_all, 'BH'),  ## overall
+              p_ref2, p_ref2_fdr=p.adjust(p_ref2, 'BH')  ## phenotype2 as reference
+ )
> res
             phenotype1 phenotype2 phenotype3       p_all  p_all_fdr      p_ref2 p_ref2_fdr
Gene_group1           2          4         26 0.121163932 0.32258065 0.499224599 1.00000000
Gene_group2           0          0          1 1.000000000 1.00000000 1.000000000 1.00000000
Gene_group3           2          6          4 0.002455027 0.02455027 0.007218474 0.07218474
Gene_group4           1          0          0 0.129032258 0.32258065 0.785262079 1.00000000
Gene_group5           0          0          2 1.000000000 1.00000000 1.000000000 1.00000000
Gene_group6           0          0          1 1.000000000 1.00000000 1.000000000 1.00000000
Gene_group7           0          0          1 1.000000000 1.00000000 1.000000000 1.00000000
Gene_group8           0          1          1 0.522474881 1.00000000 0.736850565 1.00000000
Gene_group9           3          0          6 0.078617145 0.32258065 0.093947132 0.46973566
Gene_group10          0          0          1 1.000000000 1.00000000 1.000000000 1.00000000

Note: It's unclear how the de_counts matrix was generated, and there may be more sophisticated approaches that go beyond simple Fisher tests. For example, methods like limma::camera() start directly with the RNA count matrix and account for inter-gene correlations, providing a more robust statistical framework.


Data:

> dput(de_counts)
structure(c(2L, 0L, 2L, 1L, 0L, 0L, 0L, 0L, 3L, 0L, 4L, 0L, 6L, 
0L, 0L, 0L, 0L, 1L, 0L, 0L, 26L, 1L, 4L, 0L, 2L, 1L, 1L, 1L, 
6L, 1L), dim = c(10L, 3L), dimnames = list(c("Gene_group1", "Gene_group2", 
"Gene_group3", "Gene_group4", "Gene_group5", "Gene_group6", "Gene_group7", 
"Gene_group8", "Gene_group9", "Gene_group10"), c("phenotype1", 
"phenotype2", "phenotype3")))

Note: Using a matrix instead of a data frame-like structure is more efficient, especially when doing row-wise operations. You can make a matrix out of your provided data using:

> de_counts <- `rownames<-`(counts[, -1], counts[, 1]) |> as.matrix()
$\endgroup$
0
$\begingroup$

Your code looks fine to me. For the individual phenotypes (phenotype1 vs phenotypes 2+3 and phenotype3 vs phenotypes 1+2) you can use the following minimally modified code, which adds another argument to your function and determines the indices to use to sum the other columns.

run_fisher_test2 <- function(gene_group_row, total_counts, phenotype) {
    # Add these lines
      pheno_col <- grep(substitute(phenotype), names(total_counts))
      pheno_other <- setdiff(2:4, pheno_col)
    
    # Extract the counts for the current ST group
      current_counts <- c(phenotype, sum(gene_group_row[pheno_other]))
        
    # Counts for the remaining groups
      remaining_counts <- colSums(total_counts[
        -which(total_counts$Gene_group == gene_group_row$Gene_group),  
               2:4])
    
    # Add this line
      remaining_counts <- c(remaining_counts[pheno_col - 1], 
        sum(remaining_counts[pheno_other - 1]))
          
    # Create the contingency table
      contingency_matrix <- rbind(current_counts, remaining_counts)
          
    # Run Fisher's exact test
      test_result <- fisher.test(contingency_matrix)
          
      return(test_result$p.value)
}
 
contingency_table <- contingency_table %>%
      rowwise() %>%
      mutate(p_value1 = run_fisher_test2(cur_data(), 
            contingency_table, phenotype1),
             p_value3 = run_fisher_test2(cur_data(), 
            contingency_table, phenotype3)) %>%
      ungroup()  # Ungroup after rowwise operations
    ___
    
# A tibble: 10 x 6
           Gene_group   phenotype1 phenotype2 phenotype3 p_value1 p_value3
           <chr>             <dbl>      <dbl>      <dbl>    <dbl>    <dbl>
         1 Gene_group1           2          4         26   0.141   0.0536 
         2 Gene_group2           0          0          1   1       1      
         3 Gene_group3           2          6          4   0.645   0.00489
         4 Gene_group4           1          0          0   0.129   0.306  
         5 Gene_group5           0          0          2   1       1      
         6 Gene_group6           0          0          1   1       1      
         7 Gene_group7           0          0          1   1       1      
         8 Gene_group8           0          1          1   1       0.522  
         9 Gene_group9           3          0          6   0.0831  1      
        10 Gene_group10          0          0          1   1       1

You can then add your adjusted p-values using your current code.

As an aside, cur_data() is deprecated and should be replaced with pick(everything()).

$\endgroup$
1
  • $\begingroup$ Thanks a lot. If I want to look at differences between phenotype1 vs phenotype3 would a 2 x 2 Fishers exact test using only the columns from phenotype1 and phenotype1 be ok? Or would I need to look at phenotype1 vs phenotypes 2+3 and phenotype3 vs phenotypes 1+2 instead? $\endgroup$ Commented Sep 30 at 22:17

Your Answer

By clicking “Post Your Answer”, you agree to our terms of service and acknowledge you have read our privacy policy.

Not the answer you're looking for? Browse other questions tagged or ask your own question.