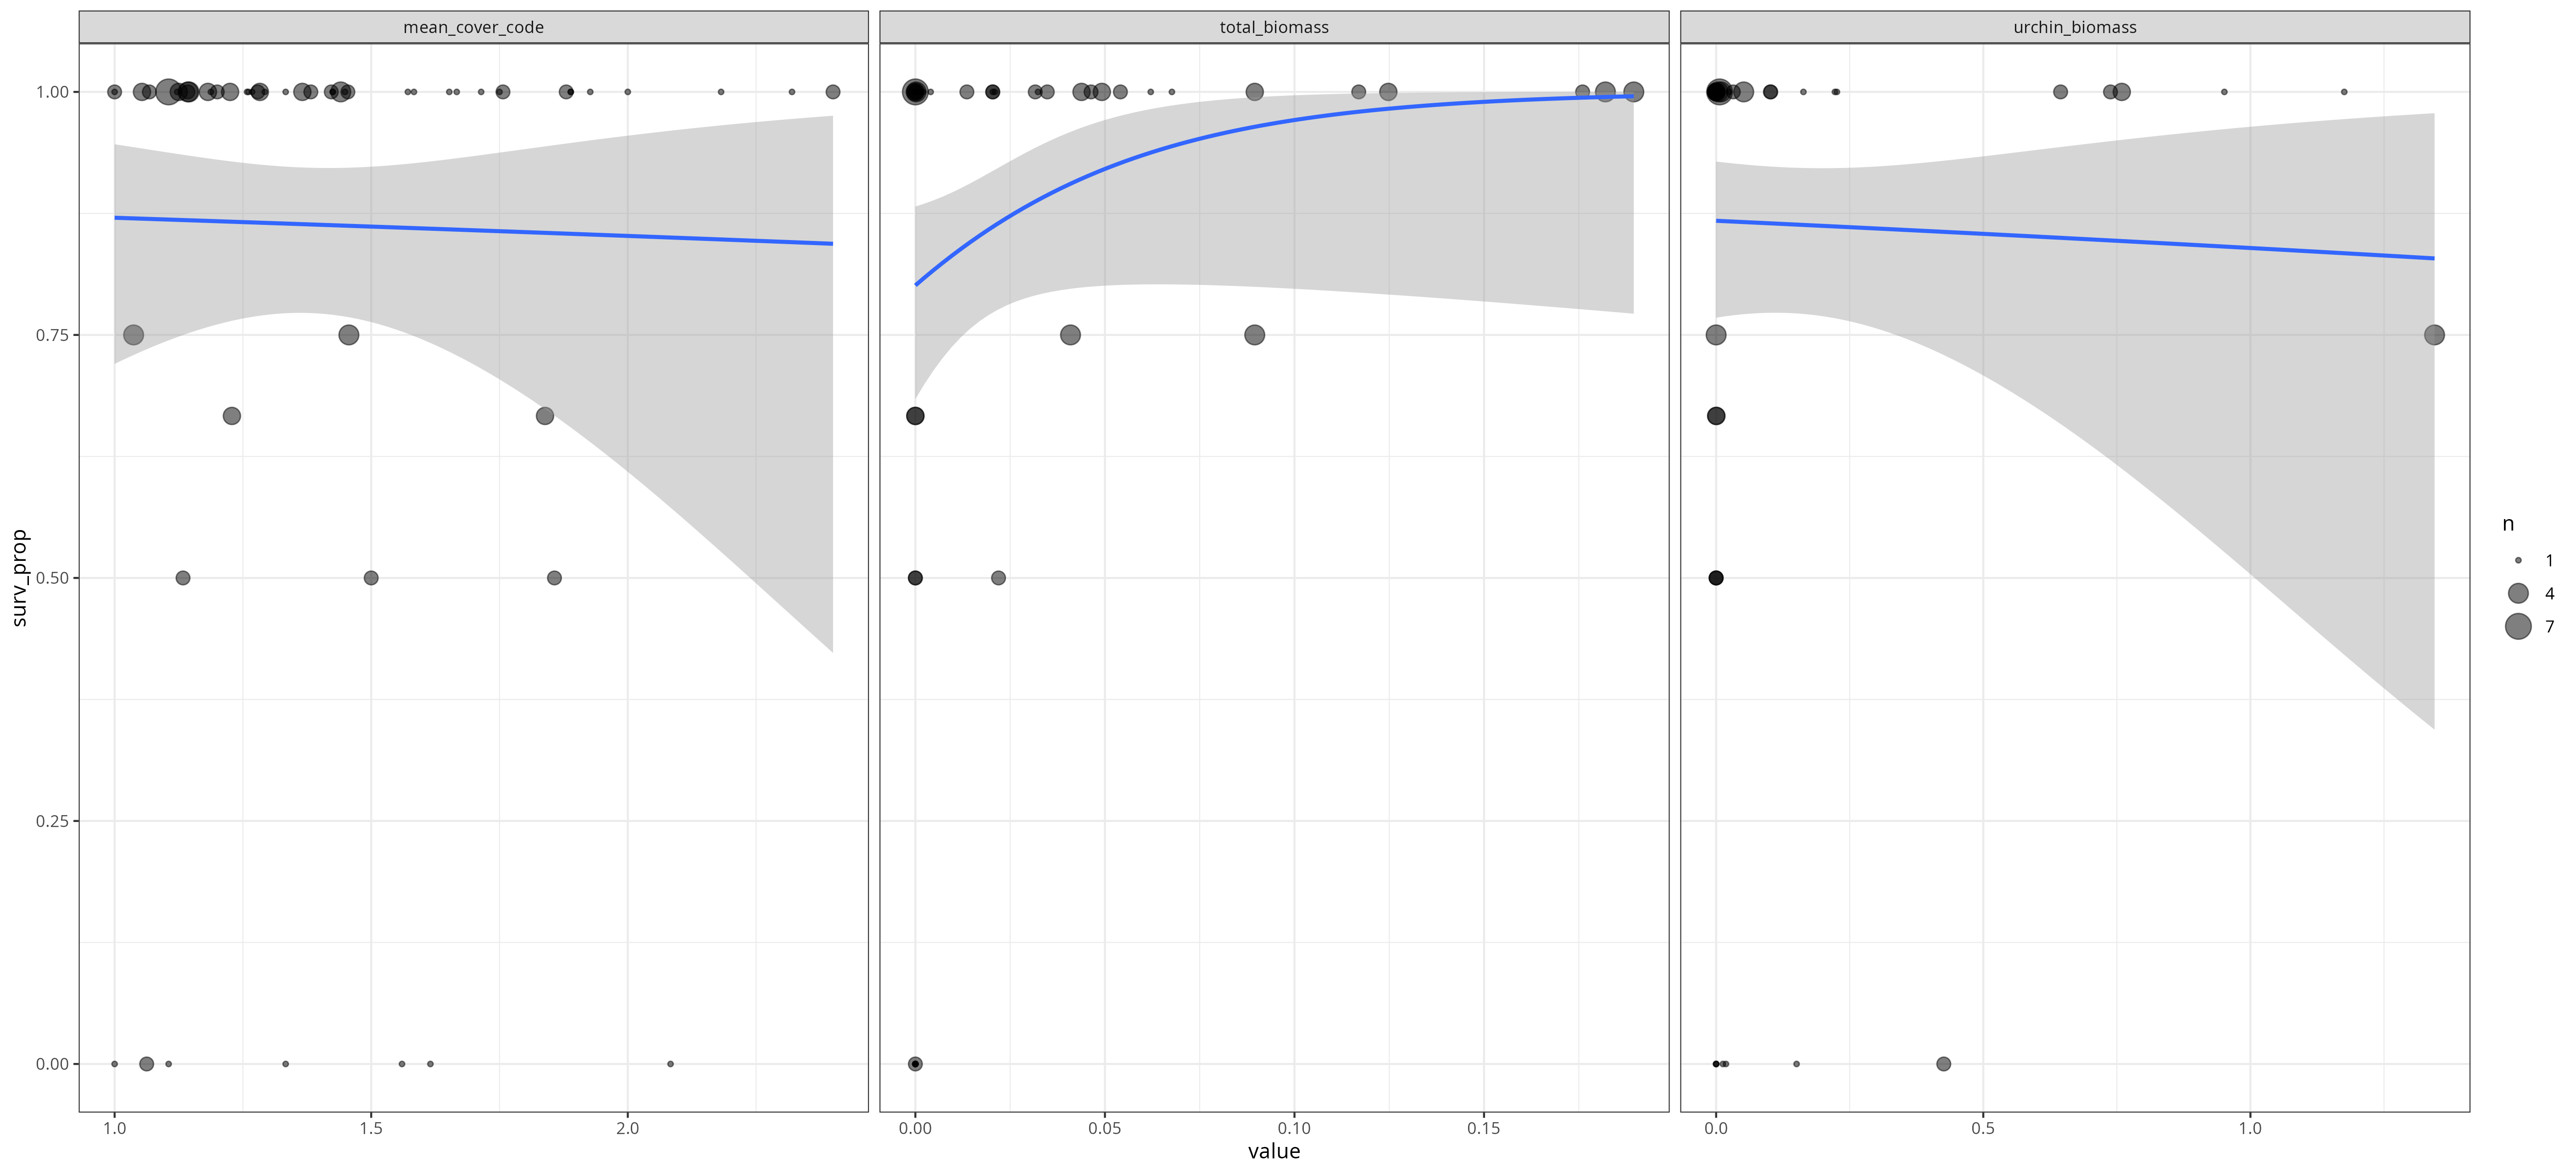
I am attempting to model bimodal continuous coral survival data that includes values of 0 and 1 (0-100% survival).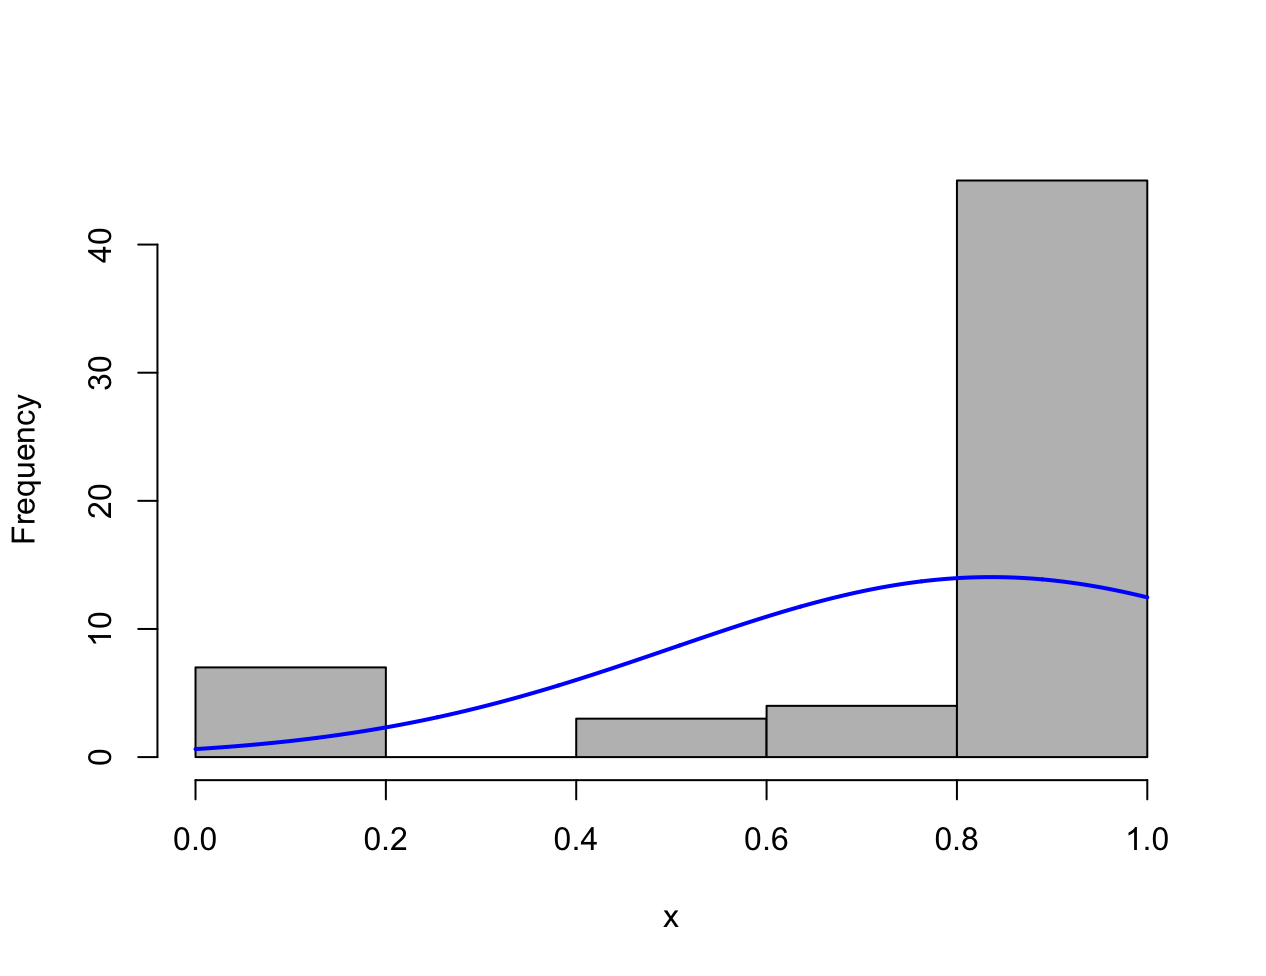
I have attempted to use linear mixed effects models (lmer and glmmTMB) with a few relevant predictors of urchin biomass, herbivorous fish biomass, and algal overgrowth as well as random effects that account for repeated measures of experimental units (1|module_urchin_fish_algae_survival) and time (1|Year/Season).
Data
urchin_fish_algae_survival_data <- structure(list(TimeStep = structure(c(2L, 2L, 2L, 2L, 2L, 2L,
2L, 3L, 3L, 3L, 3L, 3L, 3L, 3L, 3L, 4L, 4L, 4L, 4L, 4L, 5L, 5L,
5L, 5L, 5L, 5L, 5L, 5L, 6L, 6L, 6L, 6L, 6L, 6L, 6L, 7L, 7L, 7L,
7L, 7L, 7L, 8L, 8L, 8L, 8L, 8L, 8L, 8L, 9L, 9L, 9L, 9L, 9L, 9L,
10L, 10L, 10L, 10L, 10L), levels = c("2", "3", "5", "6", "7",
"8", "9", "10", "11", "12", "4"), class = "factor"), Year = c(17,
17, 17, 17, 17, 17, 17, 18, 18, 18, 18, 18, 18, 18, 18, 18, 18,
18, 18, 18, 18, 18, 18, 18, 18, 18, 18, 18, 19, 19, 19, 19, 19,
19, 19, 19, 19, 19, 19, 19, 19, 19, 19, 19, 19, 19, 19, 19, 19,
19, 19, 19, 19, 19, 20, 20, 20, 20, 20), Season = c("winter",
"winter", "winter", "winter", "winter", "winter", "winter", "summer",
"summer", "summer", "summer", "summer", "summer", "summer", "summer",
"fall", "fall", "fall", "fall", "fall", "winter", "winter", "winter",
"winter", "winter", "winter", "winter", "winter", "spring", "spring",
"spring", "spring", "spring", "spring", "spring", "summer", "summer",
"summer", "summer", "summer", "summer", "fall", "fall", "fall",
"fall", "fall", "fall", "fall", "winter", "winter", "winter",
"winter", "winter", "winter", "spring", "spring", "spring", "spring",
"spring"), `Taxonomic Code` = c("PR", "PR", "PR", "PR", "PR",
"PR", "PR", "PR", "PR", "PR", "PR", "PR", "PR", "PR", "PR", "PR",
"PR", "PR", "PR", "PR", "PR", "PR", "PR", "PR", "PR", "PR", "PR",
"PR", "PR", "PR", "PR", "PR", "PR", "PR", "PR", "PR", "PR", "PR",
"PR", "PR", "PR", "PR", "PR", "PR", "PR", "PR", "PR", "PR", "PR",
"PR", "PR", "PR", "PR", "PR", "PR", "PR", "PR", "PR", "PR"),
    Quarter = c(2, 2, 2, 2, 2, 2, 2, 4, 4, 4, 4, 4, 4, 4, 4,
    5, 5, 5, 5, 5, 6, 6, 6, 6, 6, 6, 6, 6, 7, 7, 7, 7, 7, 7,
    7, 8, 8, 8, 8, 8, 8, 9, 9, 9, 9, 9, 9, 9, 10, 10, 10, 10,
    10, 10, 11, 11, 11, 11, 11), Site_long = structure(c(2L,
    2L, 2L, 2L, 1L, 1L, 1L, 2L, 2L, 2L, 2L, 1L, 1L, 1L, 1L, 2L,
    2L, 1L, 1L, 1L, 2L, 2L, 2L, 2L, 1L, 1L, 1L, 1L, 2L, 2L, 2L,
    1L, 1L, 1L, 1L, 2L, 2L, 2L, 1L, 1L, 1L, 2L, 2L, 1L, 1L, 1L,
    1L, 1L, 2L, 2L, 1L, 1L, 1L, 1L, 2L, 2L, 1L, 1L, 1L), levels = c("Waikiki",
    "Hanauma Bay"), class = c("ordered", "factor")), Shelter = structure(c(2L,
    2L, 1L, 1L, 2L, 2L, 1L, 2L, 2L, 1L, 1L, 2L, 2L, 1L, 1L, 2L,
    1L, 2L, 2L, 1L, 2L, 2L, 1L, 1L, 2L, 2L, 1L, 1L, 2L, 2L, 1L,
    2L, 2L, 2L, 1L, 2L, 1L, 1L, 2L, 2L, 1L, 2L, 1L, 2L, 2L, 1L,
    1L, 1L, 2L, 2L, 2L, 2L, 1L, 1L, 2L, 1L, 2L, 2L, 1L), levels = c("Low",
    "High"), class = c("ordered", "factor")), `Module #` = structure(c(8L,
    10L, 9L, 11L, 3L, 5L, 4L, 8L, 10L, 9L, 11L, 3L, 5L, 4L, 6L,
    8L, 11L, 3L, 5L, 6L, 8L, 10L, 9L, 11L, 3L, 5L, 2L, 6L, 8L,
    10L, 11L, 1L, 3L, 5L, 6L, 10L, 7L, 11L, 3L, 5L, 4L, 10L,
    11L, 3L, 5L, 2L, 4L, 6L, 8L, 10L, 1L, 5L, 4L, 6L, 8L, 11L,
    1L, 5L, 4L), levels = c("111", "112", "113", "114", "115",
    "116", "212", "213", "214", "215", "216", "211"), class = "factor"),
    total_corals_new = c(1L, 4L, 1L, 7L, 3L, 1L, 2L, 1L, 3L,
    1L, 3L, 1L, 2L, 1L, 1L, 2L, 3L, 1L, 2L, 1L, 2L, 2L, 1L, 1L,
    1L, 2L, 1L, 3L, 1L, 4L, 1L, 1L, 1L, 4L, 1L, 4L, 1L, 3L, 1L,
    3L, 1L, 4L, 2L, 2L, 3L, 2L, 1L, 1L, 2L, 1L, 2L, 1L, 1L, 1L,
    1L, 2L, 2L, 2L, 1L), survive_new = c(1L, 3L, 1L, 7L, 3L,
    1L, 1L, 1L, 3L, 0L, 3L, 1L, 2L, 1L, 1L, 2L, 2L, 1L, 2L, 1L,
    2L, 2L, 1L, 1L, 1L, 2L, 0L, 3L, 1L, 4L, 1L, 1L, 1L, 3L, 1L,
    4L, 0L, 2L, 1L, 3L, 0L, 4L, 1L, 1L, 3L, 2L, 1L, 1L, 2L, 0L,
    2L, 1L, 1L, 0L, 1L, 0L, 2L, 2L, 1L), Survival_prop_new = c(1,
    0.75, 1, 1, 1, 1, 0.5, 1, 1, 0, 1, 1, 1, 1, 1, 1, 0.666666666666667,
    1, 1, 1, 1, 1, 1, 1, 1, 1, 0, 1, 1, 1, 1, 1, 1, 0.75, 1,
    1, 0, 0.666666666666667, 1, 1, 0, 1, 0.5, 0.5, 1, 1, 1, 1,
    1, 0, 1, 1, 1, 0, 1, 0, 1, 1, 1), `%_Survival` = c(100, 75,
    100, 100, 100, 100, 50, 100, 100, 0, 100, 100, 100, 100,
    100, 100, 66.6666666666667, 100, 100, 100, 100, 100, 100,
    100, 100, 100, 0, 100, 100, 100, 100, 100, 100, 75, 100,
    100, 0, 66.6666666666667, 100, 100, 0, 100, 50, 50, 100,
    100, 100, 100, 100, 0, 100, 100, 100, 0, 100, 0, 100, 100,
    100), Survival_prop = c(1, 0.75, 1, 1, 1, 1, 0.5, 1, 1, 0,
    1, 1, 1, 1, 1, 1, 0.666666666666667, 1, 1, 1, 1, 1, 1, 1,
    1, 1, 0, 1, 1, 1, 1, 1, 1, 0.75, 1, 1, 0, 0.666666666666667,
    1, 1, 0, 1, 0.5, 0.5, 1, 1, 1, 1, 1, 0, 1, 1, 1, 0, 1, 0,
    1, 1, 1), survival_trans = c(3.66356164612965, 1.0330150061823,
    3.66356164612965, 3.66356164612965, 3.66356164612965, 3.66356164612965,
    0, 3.66356164612965, 3.66356164612965, -3.66356164612965,
    3.66356164612965, 3.66356164612965, 3.66356164612965, 3.66356164612965,
    3.66356164612965, 3.66356164612965, 0.693147180559945, 3.66356164612965,
    3.66356164612965, 3.66356164612965, 3.66356164612965, 3.66356164612965,
    3.66356164612965, 3.66356164612965, 3.66356164612965, 3.66356164612965,
    -3.66356164612965, 3.66356164612965, 3.66356164612965, 3.66356164612965,
    3.66356164612965, 3.66356164612965, 3.66356164612965, 1.0330150061823,
    3.66356164612965, 3.66356164612965, -3.66356164612965, 0.655875785762714,
    3.66356164612965, 3.66356164612965, -3.66356164612965, 3.66356164612965,
    0, 0, 3.66356164612965, 3.66356164612965, 3.66356164612965,
    3.66356164612965, 3.66356164612965, -3.66356164612965, 3.66356164612965,
    3.66356164612965, 3.66356164612965, -3.66356164612965, 3.66356164612965,
    -3.66356164612965, 3.66356164612965, 3.66356164612965, 3.66356164612965
    ), Date.x.x = structure(c(17498, 17498, 17498, 17498, 17503,
    17503, 17503, 17666, 17666, 17666, 17666, 17671, 17671, 17671,
    17671, 17771, 17771, 17775, 17775, 17775, 17869, 17869, 17869,
    17869, 17873, 17873, 17873, 17873, 17974, 17974, 17974, 17977,
    17977, 17977, 17977, 18051, 18051, 18051, 18050, 18050, 18050,
    18149, 18149, 18154, 18154, 18154, 18154, 18154, 18240, 18240,
    18244, 18244, 18244, 18244, 18338, 18338, 18309, 18314, 18309
    ), class = "Date"), urchin_abundance = c(3, 44, 6, 5, 0,
    0, 0, 0, 16, 1, 0, 0, 0, 0, 0, 2, 0, 0, 1, 2, 0, 2, 1, 0,
    2, 0, 0, 1, 17, 11, 2, 1, 0, 0, 1, 14, 5, 1, 0, 0, 0, 11,
    0, 0, 0, 0, 0, 1, 9, 6, 1, 0, 0, 0, 7, 3, 2, 0, 0), urchin_biomass = c(0.163384731008009,
    1.34462237273101, 0.226062008378714, 0.00646282494123774,
    0, 0, 0, 0, 0.759170320085969, 0.150588062773737, 0, 0, 0,
    0, 0, 0.644724419353139, 0, 0, 7.04031488333154e-05, 0.0244971881937521,
    0, 0.0321448609593867, 0.222247595908095, 0, 0.951247595908095,
    0, 0, 0.001, 0.00620273058962086, 0.0516220816250144, 0.000195403148833315,
    0.000125, 0, 0, 0.008, 0.00355607590164856, 0.0126683130464739,
    0.000531, 0, 0, 0, 0.00896800616711085, 0, 0, 0, 0, 0, 0.008,
    0.738049649882475, 0.0183498173759428, 0.101646271616649,
    0, 0, 0, 1.17562759496502, 0.42606249897025, 0.102177271616649,
    0, 0), urchin_P_A = c(1, 1, 1, 1, 0, 0, 0, 0, 1, 1, 0, 0,
    0, 0, 0, 1, 0, 0, 1, 1, 0, 1, 1, 0, 1, 0, 0, 1, 1, 1, 1,
    1, 0, 0, 1, 1, 1, 1, 0, 0, 0, 1, 0, 0, 0, 0, 0, 1, 1, 1,
    1, 0, 0, 0, 1, 1, 1, 0, 0), urchin_biomass_trans = c(0.1513336279525,
    0.852124353847979, 0.203807414031673, 0.00644203043421263,
    0, 0, 0, 0, 0.564842288859823, 0.140273170609418, 0, 0, 0,
    0, 0, 0.497572843954154, 0, 0, 7.04006706478514e-05, 0.0242019441286315,
    0, 0.0316390263552368, 0.2006914555351, 0, 0.668468960768896,
    0, 0, 0.000999500333083423, 0.00618357283568116, 0.0503338117750547,
    0.000195384060124708, 0.000124992188150911, 0, 0, 0.00796816964917688,
    0.00354976801353562, 0.0125887412906613, 0.000530859069387289,
    0, 0, 0, 0.00892803241197007, 0, 0, 0, 0, 0, 0.00796816964917688,
    0.552763593686301, 0.0181834911003214, 0.0968056715594677,
    0, 0, 0, 0.777317172327479, 0.354917149201558, 0.0972875613295504,
    0, 0), Date.x = structure(c(17498, 17498, NA, NA, 17503,
    17503, NA, 17666, 17666, NA, NA, 17671, 17671, 17671, 17671,
    17771, NA, 17775, 17775, NA, 17869, 17869, NA, NA, NA, 17873,
    NA, 17873, 17974, 17974, NA, NA, NA, 17977, NA, 18051, NA,
    NA, NA, 18050, NA, 18149, NA, 18154, NA, NA, NA, 18154, NA,
    NA, 18244, NA, NA, NA, NA, NA, 18309, 18314, NA), class = "Date"),
    Year.x = c(17, 17, NA, NA, 17, 17, NA, 18, 18, NA, NA, 18,
    18, 18, 18, 18, NA, 18, 18, NA, 18, 18, NA, NA, NA, 18, NA,
    18, 19, 19, NA, NA, NA, 19, NA, 19, NA, NA, NA, 19, NA, 19,
    NA, 19, NA, NA, NA, 19, NA, NA, 19, NA, NA, NA, NA, NA, 20,
    20, NA), total_biomass = c(0.0323461388645377, 0.0895217268074256,
    0, 0, 0.0491864247516633, 0.0676700712806197, 0, 2.65128143958719,
    0.0895217268074256, 0, 0, 0.0620895115023818, 0.0204081680175056,
    0.0209695276260751, 0.00206199419933497, 0.116950643004798,
    0, 0.00403651893214743, 0.0316209605244676, 0, 0.0204081680175056,
    0.17600190357345, 0, 0, 0, 0.0463414029816723, 0, 0.0438269494805073,
    0.0204081680175056, 0.18951035289009, 0, 0, 0, 0.0409256138571204,
    0, 0.182020943223877, 0, 0, 0, 0.124762345913799, 0, 0.00018804869713669,
    0, 0.0219387977347698, 0, 0, 0, 0.00121768478272671, 0, 0,
    0.0347972963845844, 0, 0, 0, 0, 0, 0.0540876987656689, 0.013587464291258,
    0), Date.y = structure(c(17498, 17498, 17498, 17498, 17503,
    17503, 17503, 17666, 17666, 17666, 17666, 17671, 17671, 17671,
    17671, 17771, 17771, 17775, 17775, 17775, 17869, 17869, 17869,
    17869, 17873, 17873, 17873, 17873, 17974, 17974, 17974, 17977,
    17977, 17977, 17977, 18051, 18051, 18051, 18050, 18050, 18050,
    18149, 18149, 18154, 18154, 18154, 18154, 18154, 18240, 18240,
    18244, 18244, 18244, 18244, 18338, 18338, 18309, 18314, 18309
    ), class = "Date"), Year.y = c(17, 17, 17, 17, 17, 17, 17,
    18, 18, 18, 18, 18, 18, 18, 18, 18, 18, 18, 18, 18, 18, 18,
    18, 18, 18, 18, 18, 18, 19, 19, 19, 19, 19, 19, 19, 19, 19,
    19, 19, 19, 19, 19, 19, 19, 19, 19, 19, 19, 19, 19, 19, 19,
    19, 19, 20, 20, 20, 20, 20), Fish_P_A = c(1, 1, 0, 0, 1,
    1, 0, 1, 1, 0, 0, 1, 1, 1, 1, 1, 0, 1, 1, 0, 1, 1, 0, 0,
    0, 1, 0, 1, 1, 1, 0, 0, 0, 1, 0, 1, 0, 0, 0, 1, 0, 1, 0,
    1, 0, 0, 0, 1, 0, 0, 1, 0, 0, 0, 0, 0, 1, 1, 0), Date.y.y = structure(c(17498,
    17498, 17498, 17498, 17503, 17503, 17503, 17666, 17666, 17666,
    17666, 17671, 17671, 17671, 17671, 17771, 17771, 17775, 17775,
    17775, 17869, 17869, 17869, 17869, 17873, 17873, 17873, 17873,
    17974, 17974, 17974, 17977, 17977, 17977, 17977, 18051, 18051,
    18051, 18050, 18050, 18050, 18149, 18149, 18154, 18154, 18154,
    18154, 18154, 18240, 18240, 18244, 18244, 18244, 18244, 18338,
    18338, 18309, 18314, 18309), class = "Date"), total_biomass_trans = c(0.424087636584849,
    0.546993433400592, 0, 0, 0.470935374594035, 0.510034035688944,
    0, 1.27603902882338, 0.546993433400592, 0, 0, 0.499176993213155,
    0.377964495012217, 0.380537238144013, 0.213094313129101,
    0.584790964081782, 0, 0.252058732733058, 0.421690448853464,
    0, 0.377964495012217, 0.647708119444642, 0, 0, 0, 0.463972557811217,
    0, 0.457546577151736, 0.377964495012217, 0.659793807387754,
    0, 0, 0, 0.449778612693159, 0, 0.653176182423176, 0, 0, 0,
    0.594320735850033, 0, 0.117102881636956, 0, 0.384860381517112,
    0, 0, 0, 0.186802945414914, 0, 0, 0.431903154041604, 0, 0,
    0, 0, 0, 0.482252653616661, 0.341416577070112, 0), mean_cover_code = c(1,
    1.03703703703704, 1.75, 1.10526315789474, 1.125, 1.33333333333333,
    1.5, 1.2, 1.05333333333333, 1, 1.225, 1.65217391304348, 1.75675675675676,
    1.71428571428571, 1.58333333333333, 1, 1.22857142857143,
    1.66666666666667, 1.2, 1.26785714285714, 1.38235294117647,
    1.06766917293233, 1.57142857142857, 2, 1.25806451612903,
    1.14285714285714, 1.33333333333333, 1.28301886792453, 1.425,
    1.4406779661017, 1.1219512195122, 1.425, 1.29268292682927,
    1.45652173913043, 1.26086956521739, 1.14285714285714, 1.10526315789474,
    1.83870967741935, 1.92682926829268, 1.18181818181818, 1.56,
    1.14492753623188, 1.13333333333333, 1.85714285714286, 1.36585365853659,
    1.42222222222222, 1.88888888888889, 1.44897959183673, 1.27906976744186,
    1.61538461538462, 1.88, 2.18181818181818, 2.32, 2.08333333333333,
    1.1875, 1.0625, 1.45454545454545, 2.4, 1.88888888888889),
    Date_new = structure(c(17484, 17484, 17484, 17484, 17480,
    17475, 17482, 17687, 17680, 17687, 17683.5, 17675, 17677,
    17682, 17675, 17783, 17783, 17782, 17773, 17782, 17869, 17862,
    17862, 17862, 17859, 17867, 17867, 17860, 17960, 17967, 17953,
    17964, 17965, 17957, 17964, 18037, 18037, 18044, 18039, 18048,
    18039, 18142, 18135, 18139, 18140, 18140, 18139, 18144, 18233,
    18233, 18231, 18230, 18224, 18231, 18333, 18331, 18315, 18336,
    18321), class = "Date")), class = c("grouped_df", "tbl_df",
"tbl", "data.frame"), row.names = c(NA, -59L), groups = structure(list(
    TimeStep = structure(c(2L, 2L, 2L, 2L, 3L, 3L, 3L, 3L, 4L,
    4L, 4L, 4L, 5L, 5L, 5L, 5L, 6L, 6L, 6L, 6L, 7L, 7L, 7L, 7L,
    8L, 8L, 8L, 8L, 9L, 9L, 9L, 10L, 10L, 10L, 10L), levels = c("2",
    "3", "5", "6", "7", "8", "9", "10", "11", "12", "4"), class = "factor"),
    Year = c(17, 17, 17, 17, 18, 18, 18, 18, 18, 18, 18, 18,
    18, 18, 18, 18, 19, 19, 19, 19, 19, 19, 19, 19, 19, 19, 19,
    19, 19, 19, 19, 20, 20, 20, 20), Season = c("winter", "winter",
    "winter", "winter", "summer", "summer", "summer", "summer",
    "fall", "fall", "fall", "fall", "winter", "winter", "winter",
    "winter", "spring", "spring", "spring", "spring", "summer",
    "summer", "summer", "summer", "fall", "fall", "fall", "fall",
    "winter", "winter", "winter", "spring", "spring", "spring",
    "spring"), `Taxonomic Code` = c("PR", "PR", "PR", "PR", "PR",
    "PR", "PR", "PR", "PR", "PR", "PR", "PR", "PR", "PR", "PR",
    "PR", "PR", "PR", "PR", "PR", "PR", "PR", "PR", "PR", "PR",
    "PR", "PR", "PR", "PR", "PR", "PR", "PR", "PR", "PR", "PR"
    ), Quarter = c(2, 2, 2, 2, 4, 4, 4, 4, 5, 5, 5, 5, 6, 6,
    6, 6, 7, 7, 7, 7, 8, 8, 8, 8, 9, 9, 9, 9, 10, 10, 10, 11,
    11, 11, 11), Site_long = structure(c(1L, 1L, 2L, 2L, 1L,
    1L, 2L, 2L, 1L, 1L, 2L, 2L, 1L, 1L, 2L, 2L, 1L, 1L, 2L, 2L,
    1L, 1L, 2L, 2L, 1L, 1L, 2L, 2L, 1L, 1L, 2L, 1L, 1L, 2L, 2L
    ), levels = c("Waikiki", "Hanauma Bay"), class = c("ordered",
    "factor")), Shelter = structure(c(1L, 2L, 1L, 2L, 1L, 2L,
    1L, 2L, 1L, 2L, 1L, 2L, 1L, 2L, 1L, 2L, 1L, 2L, 1L, 2L, 1L,
    2L, 1L, 2L, 1L, 2L, 1L, 2L, 1L, 2L, 2L, 1L, 2L, 1L, 2L), levels = c("Low",
    "High"), class = c("ordered", "factor")), .rows = structure(list(
        7L, 5:6, 3:4, 1:2, 14:15, 12:13, 10:11, 8:9, 20L, 18:19,
        17L, 16L, 27:28, 25:26, 23:24, 21:22, 35L, 32:34, 31L,
        29:30, 41L, 39:40, 37:38, 36L, 46:48, 44:45, 43L, 42L,
        53:54, 51:52, 49:50, 59L, 57:58, 56L, 55L), ptype = integer(0), class = c("vctrs_list_of",
    "vctrs_vctr", "list"))), row.names = c(NA, -35L), .drop = TRUE, class = c("tbl_df",
"tbl", "data.frame")))
lmer Model
module_urchin_fish_algae_survival <- urchin_fish_algae_survival_data$`Module #`

urchin_fish_algae_vs_PR_6_10_survival_lmer <- lmer(Survival_prop ~ urchin_biomass + total_biomass + mean_cover_code + (1|module_urchin_fish_algae_survival) + (1|Year/Season), data = urchin_fish_algae_survival_data, na.action = "na.fail")
summary(urchin_fish_algae_vs_PR_6_10_survival_lmer)

r.squaredGLMM(urchin_fish_algae_vs_PR_6_10_survival_lmer)
#r-squared

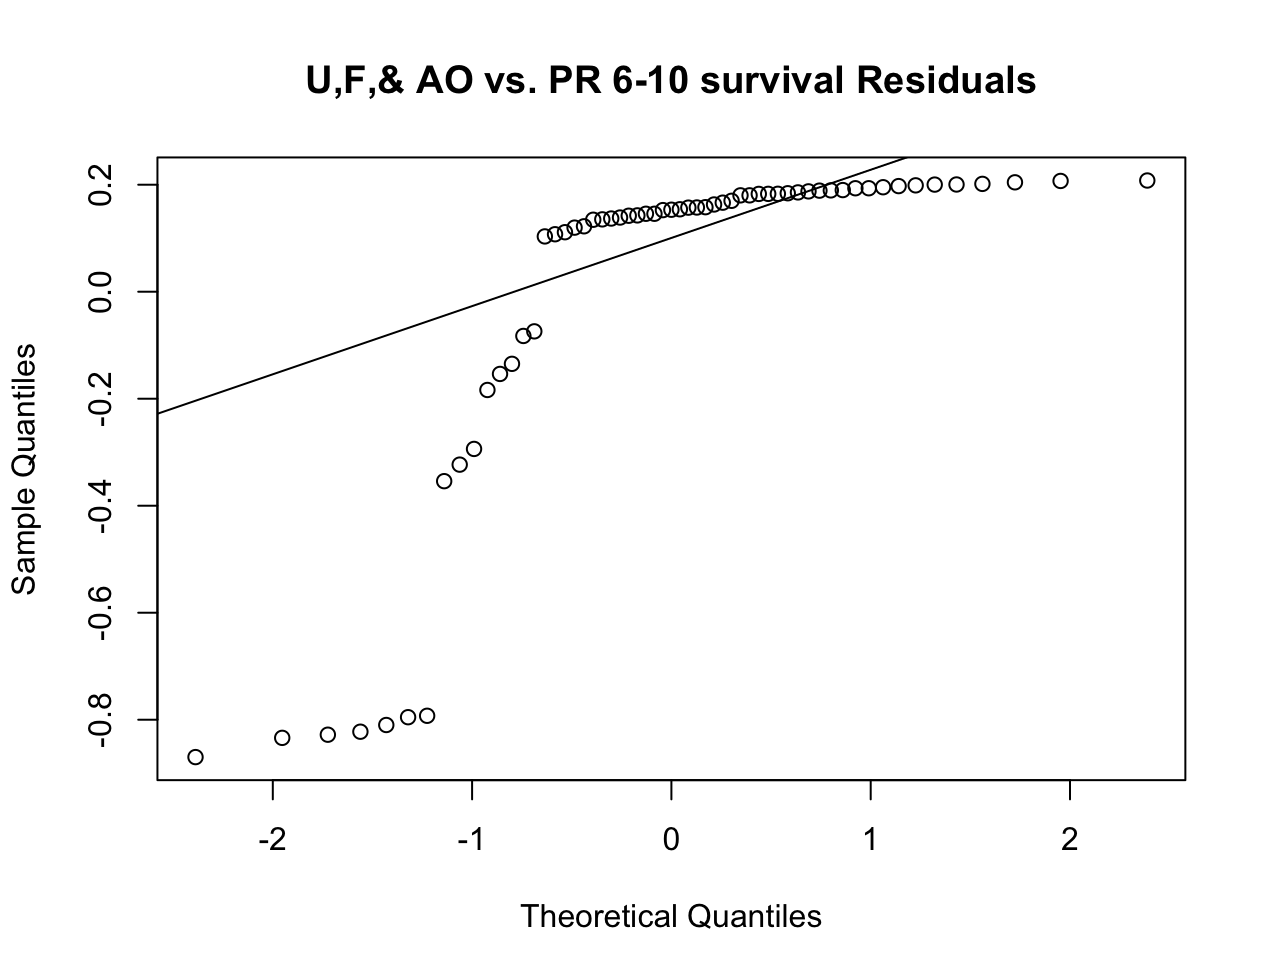
qqnorm(resid(urchin_fish_algae_vs_PR_6_10_survival_lmer), main = "U,F,& AO vs. PR 6-10 survival Residuals")
qqline(resid(urchin_fish_algae_vs_PR_6_10_survival_lmer))
# q-q plot of model fit
lmer Output
> summary(urchin_fish_algae_vs_PR_6_10_survival_lmer)
Linear mixed model fit by REML. t-tests use Satterthwaite's method ['lmerModLmerTest']
Formula: Survival_prop ~ urchin_biomass + total_biomass + mean_cover_code +      (1 | module_urchin_fish_algae_survival) + (1 | Year/Season)
   Data: urchin_fish_algae_survival_data

REML criterion at convergence: 47.2

Scaled residuals:
     Min       1Q   Median       3Q      Max
-2.54987  0.04292  0.44926  0.54697  0.60936

Random effects:
 Groups                            Name        Variance Std.Dev.
 module_urchin_fish_algae_survival (Intercept) 0.0000   0.0000
 Season:Year                       (Intercept) 0.0000   0.0000
 Year                              (Intercept) 0.0000   0.0000
 Residual                                      0.1164   0.3411
Number of obs: 59, groups:  module_urchin_fish_algae_survival, 11; Season:Year, 9; Year, 4

Fixed effects:
                Estimate Std. Error       df t value Pr(>|t|)
(Intercept)      0.70319    0.21121 55.00000   3.329  0.00156 **
urchin_biomass   0.08029    0.15973 55.00000   0.503  0.61723
total_biomass    0.10693    0.13150 55.00000   0.813  0.41965
mean_cover_code  0.08000    0.13681 55.00000   0.585  0.56111
---
Signif. codes:  0 ‘***’ 0.001 ‘**’ 0.01 ‘*’ 0.05 ‘.’ 0.1 ‘ ’ 1

Correlation of Fixed Effects:
            (Intr) urchn_ ttl_bm
urchin_bmss -0.402
total_bimss -0.195  0.084
mean_cvr_cd -0.973  0.327  0.153
optimizer (nloptwrap) convergence code: 0 (OK)
boundary (singular) fit: see help('isSingular')

> r.squaredGLMM(urchin_fish_algae_vs_PR_6_10_survival_lmer)
            R2m        R2c
[1,] 0.01644975 0.01644975
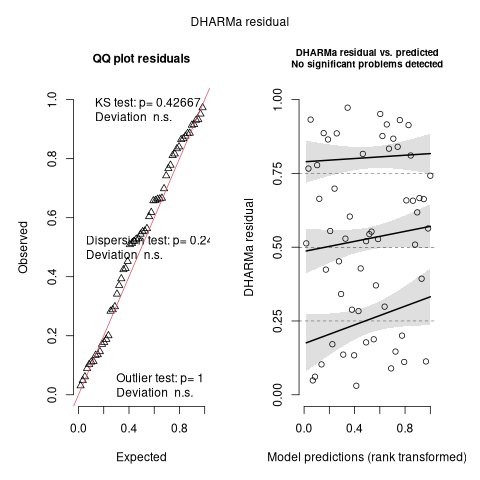
Considering the model's fit, I attempted to use a glmmTMB model with a beta-binomial family to better fit the survival data.
glmmTMB Model
# DHARMa simulated model and Q-Q plots
####################
urchin_fish_algae_vs_PR_6_10_survival_glmmTMB <- glmmTMB(Survival_prop ~ urchin_biomass + total_biomass + mean_cover_code + (1|module_urchin_fish_algae_survival) + (1|Year/Season), data = urchin_fish_algae_survival_data, na.action = "na.fail", family = "betabinomial", weights = total_corals_new)
summary(urchin_fish_algae_vs_PR_6_10_survival_glmmTMB)

r.squaredGLMM(urchin_fish_algae_vs_PR_6_10_survival_glmmTMB)
# r-squared

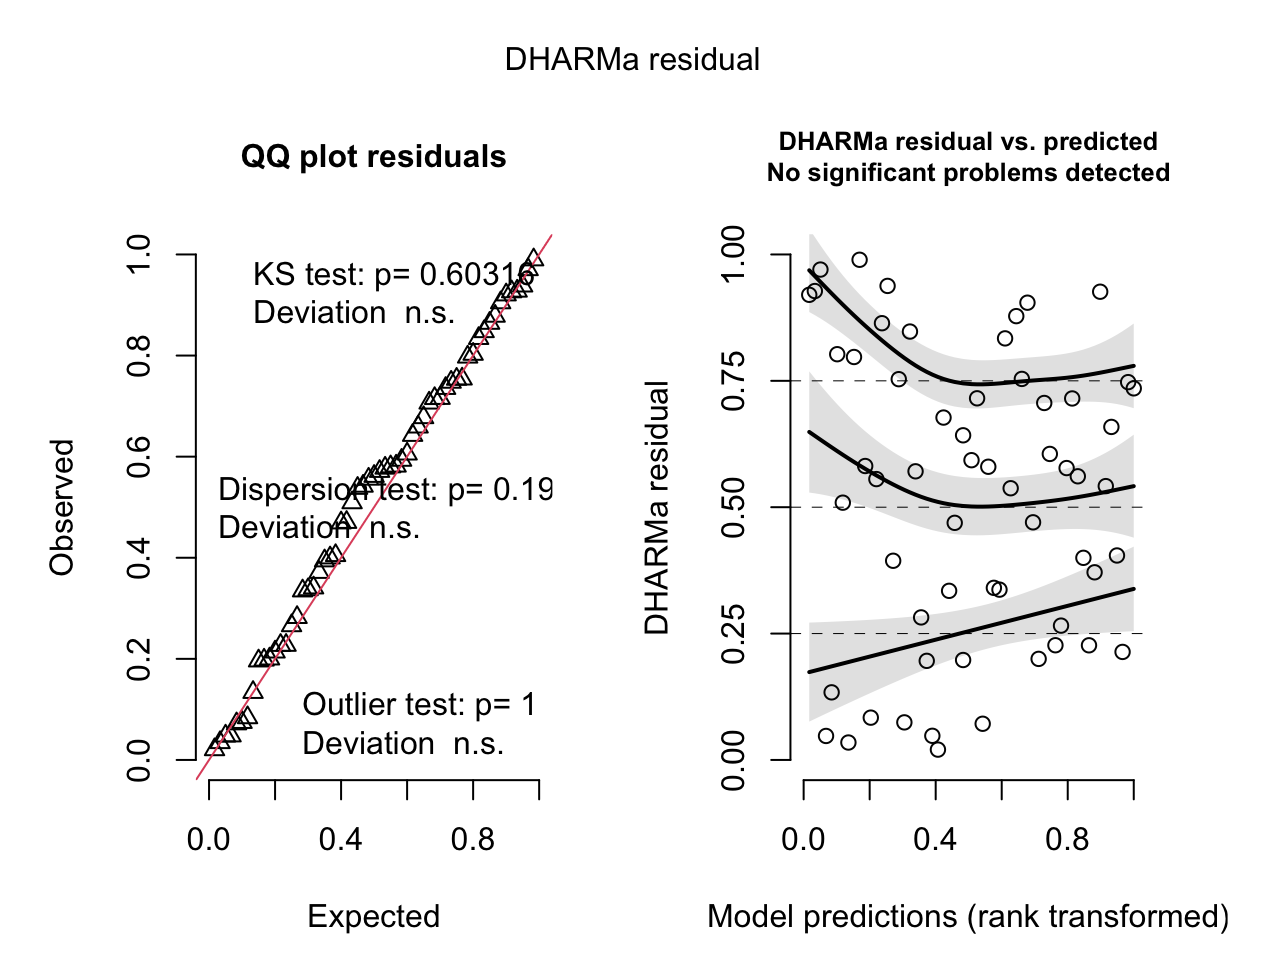
simulationOutput <- DHARMa::simulateResiduals(fittedModel = urchin_fish_algae_vs_PR_6_10_survival_glmmTMB, plot = T)
# glmmTMB simulation

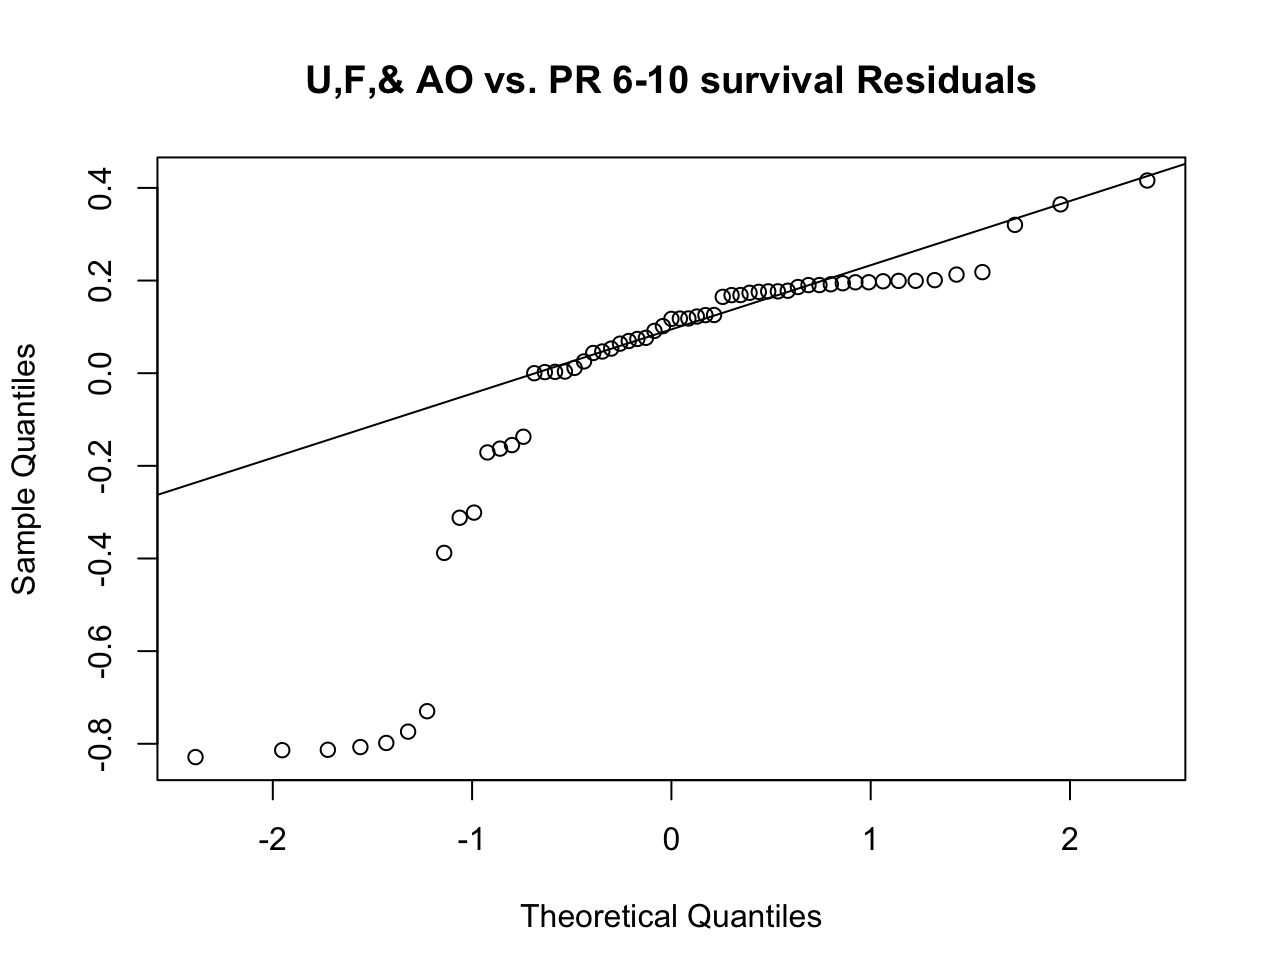
qqnorm(resid(urchin_fish_algae_vs_PR_6_10_survival_glmmTMB), main = "U,F,& AO vs. PR 6-10 survival Residuals")
qqline(resid(urchin_fish_algae_vs_PR_6_10_survival_glmmTMB))
# model fit
glmmTMB Output
> summary(urchin_fish_algae_vs_PR_6_10_survival_glmmTMB)
 Family: betabinomial  ( logit )
Formula:          Survival_prop ~ urchin_biomass + total_biomass + mean_cover_code +      (1 | module_urchin_fish_algae_survival) + (1 | Year/Season)
Data: urchin_fish_algae_survival_data
Weights: total_corals_new

     AIC      BIC   logLik deviance df.resid
    82.1     98.7    -33.0     66.1       51

Random effects:

Conditional model:
 Groups                            Name        Variance  Std.Dev.
 module_urchin_fish_algae_survival (Intercept) 1.539e-07 3.924e-04
 Season:Year                       (Intercept) 2.546e-08 1.596e-04
 Year                              (Intercept) 7.936e-09 8.909e-05
Number of obs: 59, groups:  module_urchin_fish_algae_survival, 11; Season:Year, 9; Year, 4

Dispersion parameter for betabinomial family (): 41.8

Conditional model:
                Estimate Std. Error z value Pr(>|z|)
(Intercept)       1.1717     1.4181   0.826   0.4087
urchin_biomass   -0.9045     0.9967  -0.907   0.3642
total_biomass    24.4777    12.4731   1.962   0.0497 *
mean_cover_code   0.1945     0.9303   0.209   0.8344
---
Signif. codes:  0 ‘***’ 0.001 ‘**’ 0.01 ‘*’ 0.05 ‘.’ 0.1 ‘ ’ 1

> r.squaredGLMM(urchin_fish_algae_vs_PR_6_10_survival_glmmTMB)
     R2m R2c
[1,]   1   1

> simulationOutput <- DHARMa::simulateResiduals(fittedModel = urchin_fish_algae_vs_PR_6_10_survival_glmmTMB, plot = T)
# glmmTMB simulation

> qqnorm(resid(urchin_fish_algae_vs_PR_6_10_survival_glmmTMB), main = "U,F,& AO vs. PR 6-10 survival Residuals")
> qqline(resid(urchin_fish_algae_vs_PR_6_10_survival_glmmTMB))
# model fit
While the fit of the glmmTMB model does appear to be better, there are a couple of concerns. First, there is still a massive tail from the normal line (although less so than for the lmer model). Secondly, the marginal and conditional r-squared values are both 1 which gives me pause about the reliability of this model.
I am seeking any suggestions on how to 1.) correctly calculate r-squared values for glmmTMB models as I do not believe the fit is 100% as indicated by r.squaredGLMM() and 2.) are there any other models or family distribution suggestions to better fit these data.
I have tried binomial distributions as well but they do not work since values of 0 and 1 exist within the database. Any suggestions would be greatly appreciated. Thank you for your time.

