2
$\begingroup$

I'm working on a model of saving account amounts. It shows a seasonality: On the 1st day of every month the amount always decreases.

This is reasonable as people probably need draw money to pay rental or other everyday bills.

However, before seasonality adjustment is applied, I'm wondering: Is there a criterion of seasonality?

For example, is there some “ratio” or “index” that could suggest the existence or obvious character of seasonality?

$\endgroup$
3
  • $\begingroup$ Why not a simple linear regression with binary variable for each period ? $\endgroup$
    – PAC
    Commented Jul 30, 2013 at 11:09
  • $\begingroup$ 31 models for each day of the month? mmm.... possible, but let me try other ways first... $\endgroup$
    – athos
    Commented Jul 31, 2013 at 0:44
  • $\begingroup$ @PAC You would have to take into account (condition for) day-of-the-week , month-of-the-year, effect of holidays , effect of autoregressive memory , effect of level shifts/local time trends, week of the month .....possible changes in model parameters or error variance over time. $\endgroup$
    – IrishStat
    Commented Sep 28, 2013 at 16:01

2 Answers 2

3
$\begingroup$

I think a good criterion is having a significant autocorrelation in a given lag of your data. Let me add an example taken from Cowpertwait's Introductory Time Series with R:

Suppose you have the following data and want to fit a linear model with harmonic components:

data(AirPassengers)
AP <- AirPassengers

SIN <- COS <- matrix(nr = length(AP), nc = 6)
for (i in 1:6) {
SIN[, i] <- sin(2 * pi * i * time(AP))
COS[, i] <- cos(2 * pi * i * time(AP))
}
TIME <- (time(AP) - mean(time(AP)))/sd(time(AP))
mean(time(AP))

AP.lm2 <- lm(log(AP) ~ TIME + I(TIME^2) + SIN[,1] + COS[,1] +
SIN[,2] + COS[,2] + SIN[,3] + SIN[,4] + COS[,4] + SIN[,5])

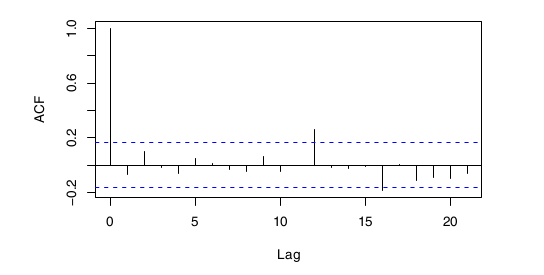
Obviously, this linear model is going to have some residuals. Calculating the autocorrelation function, you obtain the following plot (blue dotted line shows significance threshold):

AP.ar <- ar(resid(AP.lm2), order = 1, method = "mle")
enter image description here

This is telling you that there is a significant autocorrelation in lag 12 (that is, there is a correlation between each value $x_{i}$ and $x_{i+12}$ in your dataset). Therefore, you can conclude the linear model doesn't account for such seasonal variation.

In this case, the data refers to the international air passenger booking per month in an airline, so you can expected a seasonal variation.

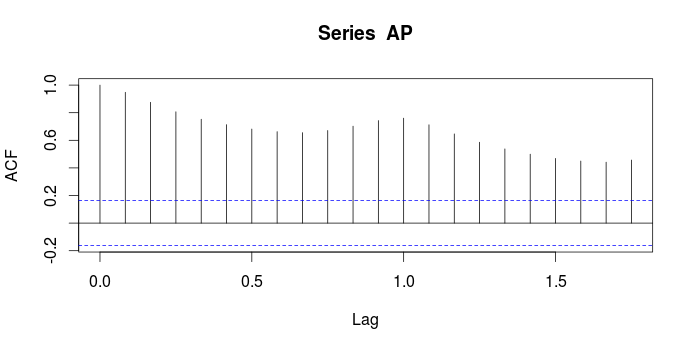
If you perform an autocorrelation on the data itself, you will see that there is a very strong autocorrelation in almost every lag (Here lag 1 means 12 months)
enter image description here

In this way, you can quantify whether or not there is a seasonal trend and how good your model is explaining such variations.

$\endgroup$
1
$\begingroup$

The point about seasonality is that there is more or less systematic variation within each year. Patterns within months as in your example would be included under many but perhaps not all definitions, but it is often best not to worry too much about definitions.

So, the opposite case or lack of seasonality might seem to be constancy within a year. Hence we might think of something like standard deviation of values within a year as a measure, looking at variability between (say) quarterly, monthly, weekly or daily values.

However, that is pretty much useless in practice as a criterion. For example:

  1. Even if there were no seasonality in the sense of systematic variation, there is usually some irregular variability within a year.

  2. Even if there were no seasonality, a trend could still imply lack of constancy within a year.

In practice, seasonality is evident from ordinary or subject-matter knowledge (e.g. climate, sales cycles) and/or obvious on a graph when plotting against time or time of year. Graphics may sound trivial but the most familiar graphs may not be the most effective. For reviews of graphics for seasonality see http://www.stata-journal.com/sjpdf.html?articlenum=gr0025 and http://www.stata-journal.com/sjpdf.html?articlenum=gr0037

Once you start modelling, you will need to make more definite decisions on how to model the seasonal component in conjunction with others.

$\endgroup$

Your Answer

By clicking “Post Your Answer”, you agree to our terms of service and acknowledge you have read our privacy policy.

Not the answer you're looking for? Browse other questions tagged or ask your own question.