I have two variables, one containing project delivery rates for a particular language, and the second containing team size that worked on these projects. I am particularly new to statistics and I want to test the two variables which may or may not be dependent. In other words I want to test the dependency of these two variables. I am using SPSS. Can someone guide me in this regard, which statistical tools can or should be employed for the above scenario?
1 Answer
So there are many possible methods to check for the dependency between two variables, but probably the easiest way (as @Martyn suggestion) is to check the correlation between the variables. If you are a fan of statistical tests and p-values then you can even run a test to see whether or not the two variables have a statistically significant correlation, but I prefer to simply calculate the correlation and to plot the two variables (as a scatterplot) against each other to check for underlying dependencies. Here are some plots illustrating some possibly patterns you could see and some pitfalls to avoid:
So as with figure 1, you could have a very high positive correlation between the two variables. So as one variable increases so does the other variable.
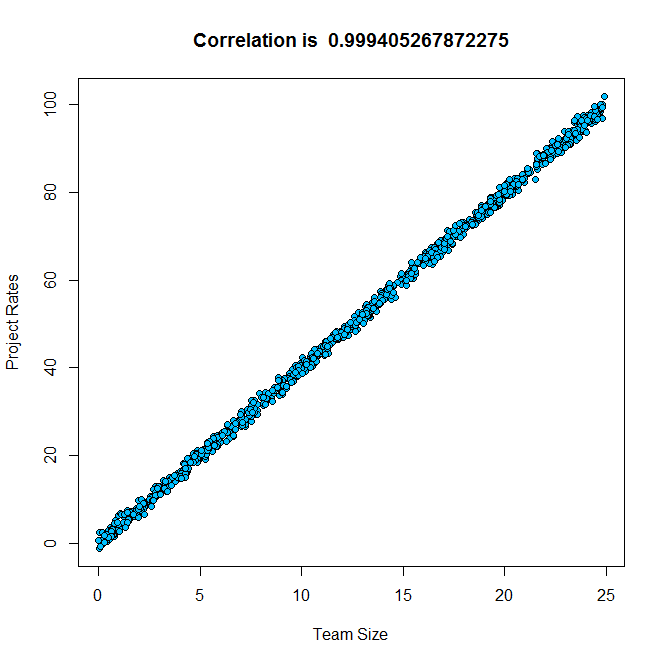
Figure 2, you could still have a high positive correlation but with more dispersion (or rather less association between the two variables).
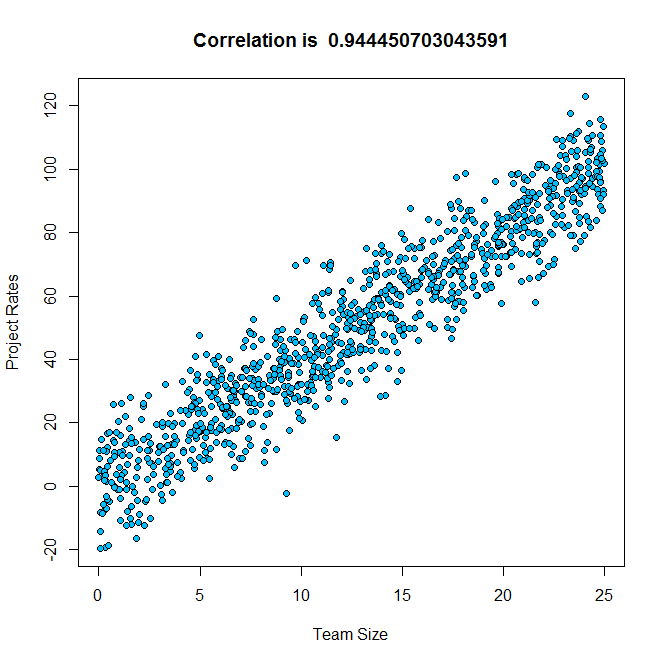
Figure 3, you could have a negative correlation between the two variables. So as one variable increases the other variable will decrease (and vise versa).
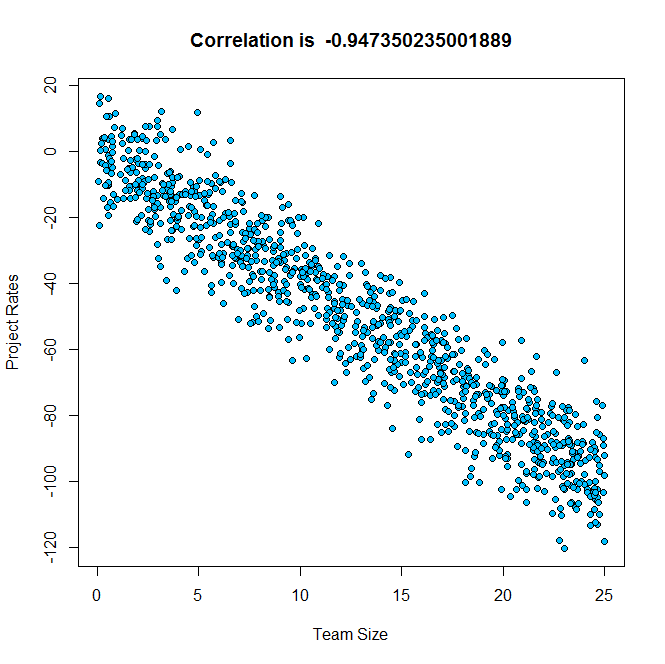
Figure 4, there could be no apparent correlation between the two variables (correlation close to zero) and so we would not be able to distinguish a linear relationship between the two.
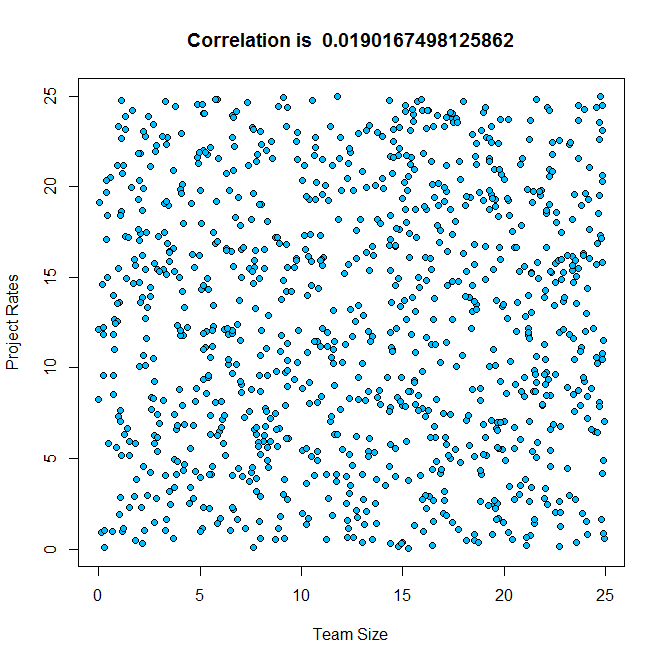
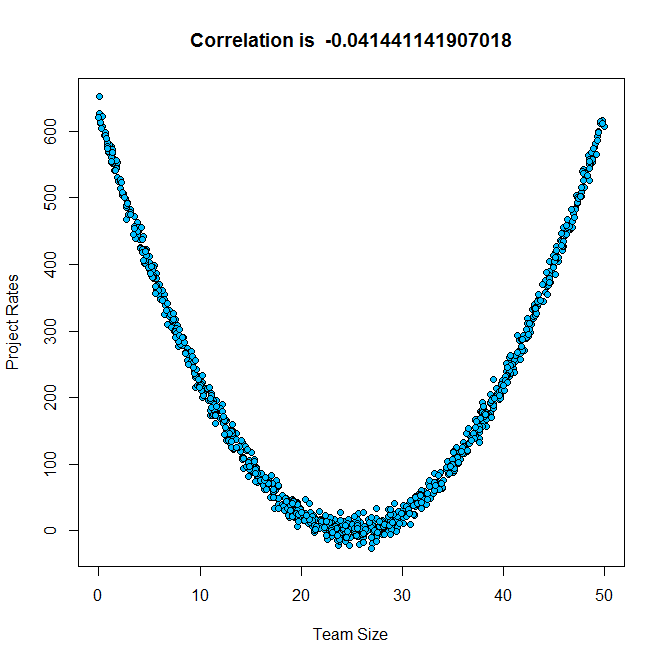
Figure 5, here is a pitfall you want to avoid and this is why it is wise to plot the data as well as check the correlation. Remember that correlation measures linear association, and so a correlation of zero does not imply that there is no association between the variables it just implies there is no LINEAR association. Clearly from the figure there is an association its just not linear.
I don't use SPSS so sorry I cannot help you out on that front.
-
$\begingroup$ Thanks. Pearson correlation shows a 0.085 meaning no correlation right? logically though delivery rates should be correlated with team size. Or am i wrong? $\endgroup$ Commented Sep 15, 2013 at 18:07
-
$\begingroup$ wonderful the way you explained it though $\endgroup$ Commented Sep 15, 2013 at 18:14
-
$\begingroup$ Well try plotting the data as well to see what that reveals. A Pearson correlation of 0.085 would suggest that there is no linear relationship between delivery rates and team size. I cannot however comment on whether they SHOULD or SHOULD NOT be correlated although intuitively you would think that they would. Its very unlikely but you could have potential outliers masking the relationship so a plot of the variables would be very helpful to check for this. $\endgroup$– user25658Commented Sep 15, 2013 at 18:38
