36
$\begingroup$

When one bootstraps a parameter to get the standard error we get a distribution of the parameter. Why don't we use the mean of that distribution as a result or estimate for the parameter we are trying to get? Shouldn't the distribution approximate the real one? Therefore we would get a good estimate of the "real" value? Yet we report the original parameter we got from our sample. Why is that?

Thanks

$\endgroup$

4 Answers 4

29
$\begingroup$

Because the bootstrapped statistic is one further abstraction away from your population parameter. You have your population parameter, your sample statistic, and only on the third layer you have the bootstrap. The bootstrapped mean value is not a better estimator for your population parameter. It's merely an estimate of an estimate.

As $n \rightarrow \infty$ the bootstrap distribution containing all possible bootstrapped combinations centers around the sample statistic much like the sample statistic centers around the population parameter under the same conditions. This paper here sums these things up quite nicely and it's one of the easiest I could find. For more detailed proofs follow the papers they're referencing. Noteworthy examples are Efron (1979) and Singh (1981)

The bootstrapped distribution of $\theta_B - \hat\theta$ follows the distribution of $\hat \theta - \theta$ which makes it useful in the estimation of the standard error of a sample estimate, in the construction of confidence intervals, and in the estimation of a parameter's bias. It does not make it a better estimator for the population's parameter. It merely offers a sometimes better alternative to the usual parametric distribution for the statistic's distribution.

$\endgroup$
15
$\begingroup$

There is at least one case where people do use the mean of the bootstrap distribution: bagging (short for bootstrap aggregating).

The basic idea is that if your estimator is very sensitive to perturbations in the data (i.e., the estimator has high variance and low bias), then you can average over lots of bootstrap samples to reduce the amount of overfitting particular examples.

The page I linked to points out that this introduces some bias into your estimate, which is why the sample mean will often make more sense than averaging your bootstrap samples. But if you have something like a decision tree or a nearest neighbor classifier that can change radically in response to small changes in the data, then this bias might not be as big a concern as overfitting.

$\endgroup$
3
  • 1
    $\begingroup$ I'm not sure I understand your question. I didn't actually use the phrase "bias of a parameter." I'm also not entirely sure what you mean by $y$ versus $\theta$ in this context. $\endgroup$ Commented Sep 29, 2013 at 18:04
  • $\begingroup$ I normally see bagging used to reduce the variance of one's estimates for the response (i.e. its sensitivity to fluctuations in the data). The most commonly bagged models (e.g. trees) typically don't have well-defined parameters that would be easily compared across bootstrap samples. $\endgroup$ Commented Sep 29, 2013 at 19:41
  • $\begingroup$ Thanks, that's exactly what I thought as well. To me bagging does not seem to make much sense for anything other than the estimate of a response, so it is limited in that sense. $\endgroup$
    – Momo
    Commented Sep 29, 2013 at 19:59
11
$\begingroup$

It is worth noting that the difference between the mean of bootstrapped samples $\theta_B$ and the sample estimate $\hat{\theta}$ can sometimes be used as an estimate of the bias of $\hat{\theta}$ in estimating the true parameter $\theta$.

$\endgroup$
-1
$\begingroup$

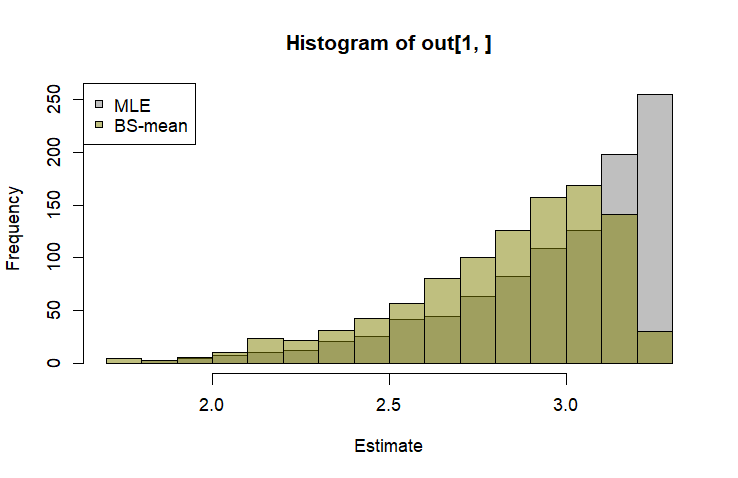
One simple answer, because it's biased.

A simple example, estimate the upper bound of a $\text{Uniform}(0, \theta)$ random variable. Here, I take 1,000 bootstrap samples of a $n=10$ random sample, and calculate the MLE for each BS subsample and average them together. The relative bias is 5%!

set.seed(123)
out <- replicate(1000, {
  n <- 10
  u <- runif(n, 0, 3)
  mle <- max(u)*(n+1)/n
  
  bsm <- mean(replicate(1000, {
    max(sample(u, replace=T))*(n+1)/n
  }))
  c(mle, bsm)
})
    
b <- hist(out[1, ], col=c1 <- rgb(0.5, 0.5, 0.5, 0.5), breaks=pretty(out, 20), xlab='Estimate')
hist(out[2, ], breaks = b$breaks, col=c2 <- rgb(0.5, 0.5, 0, 0.50), add=T)

enter image description here

$\endgroup$

Your Answer

By clicking “Post Your Answer”, you agree to our terms of service and acknowledge you have read our privacy policy.

Not the answer you're looking for? Browse other questions tagged or ask your own question.