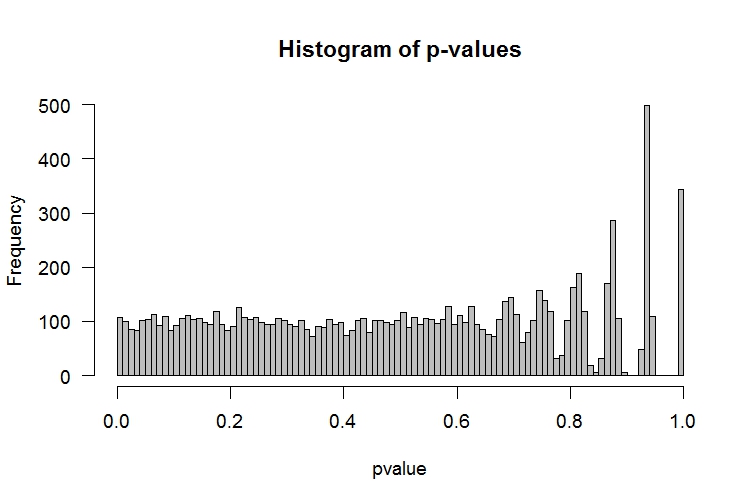
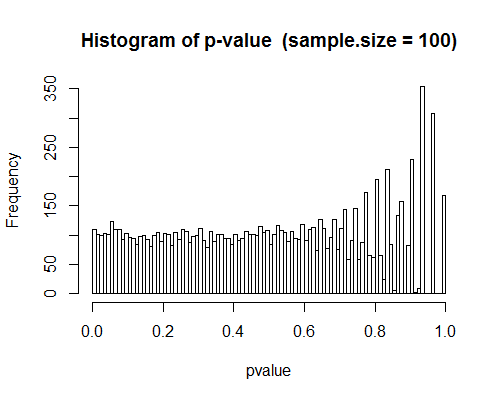
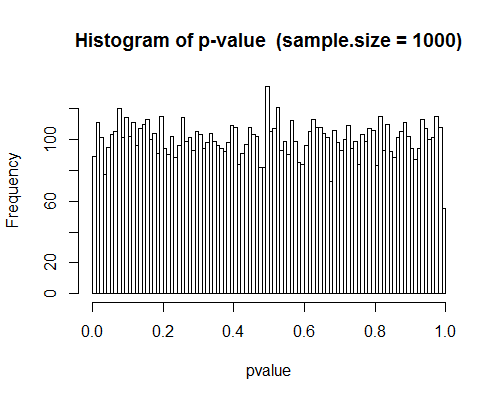
I have created a vector of length 400 with 6 unique values of relatively equal proportions (1-6). I have drawn two random samples from the vector, each $n=26$, 10,000 times, performed $t$-tests, added the $p$-values to a list and output a histogram of the $p$-value frequency. The histogram of the $p$-values shows a cyclical clumping effect for $p$-values greater than $0.7$. I would like to know why this occurs.
Here is my R-code:
set.seed(117)
cover1<-rep(1,100)
cover2<-rep(2,63)
cover3<-rep(3,59)
cover4<-rep(4,74)
cover5<-rep(5,56)
cover6<-rep(6,48)
landscape=c(cover1,cover2,cover3,cover4,cover5,cover6)

sample.size<-26
x<-10000
pval.list <-vector("list", length(x))
alpha <- 0.05
conf.level <- 1 - alpha
for(i in 1:x){

  s1 <- sample(landscape, size = sample.size, replace = TRUE, prob = NULL)
  s2 <- sample(landscape, size = sample.size, replace = TRUE, prob = NULL)
  result.t.test <- t.test(s1,s2, conf.level=conf.level)
  pval.list[i] <- result.t.test["p.value"]
}
s<-pval.list
pvalue<-as.numeric(s)
hist(pvalue, main = paste("Histogram of" , "p-value"), breaks= 100)


