7
$\begingroup$

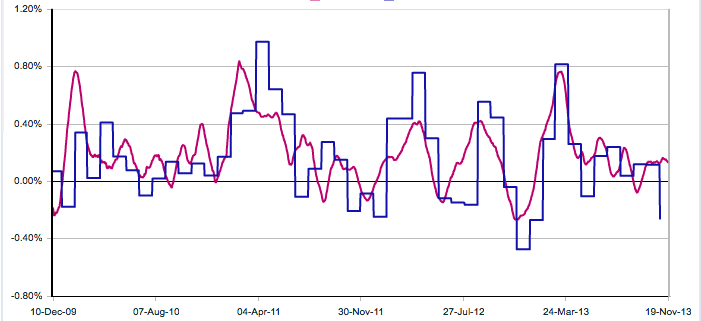
enter image description here

Info:

Blue line is the official inflation statistics by US Bureau of Labour Stats
Red line is by independent researchers who claim to have created better way to measure inflation

Blue line has been sampled once every month
Red line has been sampled daily

It can be seen that the red line is tracking inflation ahead of the blue line.


Basically these are two time series, with different sampling frequencies, that are tracking the same phenomenon, i.e. change in general price levels. I need advice on how I should go about analysing these processes. What are some possible hypothesis I could be testing for?

UPDATE: After mpiktas' suggestion, my current plan is to a MIDAS regression with some polynomial function for the weights and report the forecasting capabilities of the model. (and perhaps contrast this to a model using a simple-time-averaged red line)

Some of you might have done something similar to this, is there anything I should keep in mind or anything additional I could be doing that would complement this 6000 word project?

Additional:

  • If you can link me to some very relevant papers that have done similar analysis that would help.

Any input will be apreciated

$\endgroup$
8
  • 3
    $\begingroup$ Economists have traditionally used low frequency data (like monthly or quarterly). There has been a lot of work on developing higher frequency data to improve forecasts. So you might look into mixed frequency techniques (Midas or Kalman Filters might be a start). $\endgroup$
    – John
    Commented Nov 24, 2013 at 3:58
  • 1
    $\begingroup$ Before asking the data anything, make sure that you study and fully understand what does it mean, and what does it take, to try to compare/examine/contrast data of different frequency. $\endgroup$ Commented Nov 24, 2013 at 4:00
  • $\begingroup$ Running tests without some goal is usually meaningless. What are you trying to achieve? To what end will you use this data? $\endgroup$
    – mpiktas
    Commented Nov 27, 2013 at 8:21
  • $\begingroup$ @mpiktas I was thinking about showing that it is possible to use the red line as a predictor for the blue line. This is important because a lot of policy decisions depend on the blue line and if I can show that the red line forecasts the blue line, then there would be some real world relevance to this analysis. I also have a feeling that it would be overkill to do tests or analysis to show that the red line is a predictor, its already really obvious from the plot. What are your thoughts? Im struggling to find a decent project idea for my course. $\endgroup$ Commented Nov 27, 2013 at 8:46
  • 1
    $\begingroup$ Yes, this a natural start. You might also want to use rolling forecasts and the forecasting model $Y_{t+h}=\sum_{j=0}^kX_{tm-h}+\varepsilon_{t+h}$, i.e. forecast the t+h observation using the data until $t$, this is how usually MIDAS regression is used. For example you can forecast the current monthly value using half-month data of high frequency regressor. $\endgroup$
    – mpiktas
    Commented Nov 27, 2013 at 9:58

3 Answers 3

4
+50
$\begingroup$

For forecasting low frequency variables with high frequency you can use MIDAS regression. The idea behind this regression is quite simple, average the high-frequency variable and then use it as a regressor. The key is to use custom weights. Suppose we have $Y_t$ which is sampled monthly and $X_\tau$, which is sampled daily. Then MIDAS regression is defined as follows:

$$Y_t=\sum_{h=0}^k\beta_hX_{tm-h}+\varepsilon_t$$

where we assume that for observation $t=s$ we have $m$ observations $\tau=sm-m+1,...,sm$. We also assume that $\beta_h=g(h,\theta)$, for some function $g$ and hyperparameter $\theta$.

So if you want to test out whether the $X_\tau$ is a good predictor for $Y_t$, fit a MIDAS regression with different weight functions and inspect the results.

If you enter MIDAS regression into google you'll find many articles. Forecasting monthly CPI with daily variable was investigated in the article "Forecasting with mixed frequencies" by Armesto, Engemann and Owyang.

The MIDAS regression idea was introduced by Eric Ghysels, you can look into his articles.

There are two software packages for fitting MIDAS regression: MIDAS Matlab toolbox and midasr R package. They both have user guides, where you can find more detailed examples and links to other literature.

Note, this is only one possible way of solving your problem. Others surely exist too, but as I am the developer of midasr R package, I am biased in my suggestions.

$\endgroup$
3
  • $\begingroup$ Hey mpiktas, I converted my daily data into a zoo object(it seems zoo is easier to work with for daily), and my dependent variable is a monthly variable which I converted into a ts object. during estimation, (i.e. midas_r(yy ~ mls(yy,1,1) + mls(xx,1:3,30)), what should i set the frequency for the xx as? Is there a better way to deal with monthly data regressed on daily data? $\endgroup$ Commented Mar 20, 2014 at 20:35
  • 1
    $\begingroup$ You must make all the months to have an equal number of days. And then set frequency to that number. You can achieve that by discarding data, padding NAs or extrapolating. If you use lags smaller than 28, padding NAs is the easiest solution. $\endgroup$
    – mpiktas
    Commented Mar 21, 2014 at 3:19
  • $\begingroup$ Thanks for the reply mpiktas, could I please direct you to this related question of mine, stackoverflow.com/questions/22572162/… $\endgroup$ Commented Mar 22, 2014 at 1:32
0
$\begingroup$

For starters, I would check if the draws from list A are two standard deviations outside of the draws from list B.

Secondly, I would check if a 1 month moving average of list A is significantly different from the more slowly sampled list B.

$\endgroup$
0
$\begingroup$

Fit seasonal time series models to both and then compare the seasonality. The TBATS model can handle daily data. It is available in the forecast package in R.

$\endgroup$

Your Answer

By clicking “Post Your Answer”, you agree to our terms of service and acknowledge you have read our privacy policy.

Not the answer you're looking for? Browse other questions tagged or ask your own question.