You can certainly use a two sample proportions test.
Indeed, since it sounds like your alternative is one tailed, that's probably what you want; the other common choice - the chi-square - doesn't do one-tailed alternatives.
For small samples, you could use the fact that (given the usual assumptions, at least) the proportions are discrete. Depending on whether you condition on one margin or both, either binomial or hypergeometric. [However, it's actually a bit tricky to do the calculations if you avoid conditioning on the second margin when computing the discrete distribution; there are a couple of approaches to doing it which I won't explore here].
For larger samples (where 'large' is actually pretty small for this problem) you could use the normal approximation (possibly with continuity correction).
Your example numbers are easily large enough to use the normal approximation.
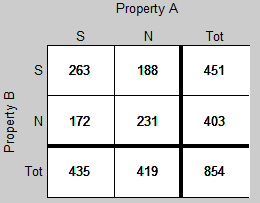
Example of the calculations, on those numbers:
      A   notA  Tot
   B 263  188   451
notB 172  231   403
 Tot 435  419   854
What is the correct test to see whether having property A raises the chance of having property B?
This is equivalent to considering the following hypothesis:
Let $\pi_B$ be the population proportion with property B, $\pi_{B|A}$ be the population proportion with property B among those with property A, and $\pi_{B|\bar A}$ be the population proportion with property B among those without property A,
$H_0:\, \pi_{B|A} = \pi_{B|\bar A} = \pi_B $ vs
$H_{a^1}:\, \pi_{B|A} > \pi_{B|\bar A}$ (for a one tailed test)
$H_{a^2}:\, \pi_{B|A} \neq \pi_{B|\bar A}$ (for a two tailed test)
Let $p_B$ (etc) be the corresponding sample proportions.
Then $Z = \frac{p_{B|A}-\, p_{B|\bar A}}{\sqrt{\text{Var}_0(p_{B|A}-\, p_{B|\bar A})}}$ is a suitable test statistic.
The usual pooled estimate of the variance is:
$\text{Var}_0(p_{B|A}-\, p_{B|\bar A}) = p_B(1-p_B)(\frac{1}{n_{A}} +\frac{1}{n_{\bar A}})$
(which under $H_0$ should be the best estimate of the variance of the numerator), though some packages use the unpooled estimate:
$\text{Var}(p_{B|A}-\, p_{B|\bar A}) = p_{B|A}(1-p_{B|A})/{n_{A}} +p_{B|\bar A}(1-p_{B|\bar A})/{n_{\bar A}}$
From the above data,
$p_B = 451/854 $, $ $ $p_{B|A} = 263/435 $, $ $ $p_{B|\bar A} = 188/419 $
$n_{A} = 435$, $ $ $n_{\bar A} = 419$
$\text{Var}_0(p_{B|A}-\, p_{B|\bar A}) = \frac{451}{854} \frac{403}{854} (\frac{1}{435} +\frac{1}{419})=0.001168$
without continuity correction,
$Z = \frac{263/435-\, 188/419}{\sqrt{0.001168}} = 4.56$
The one tailed p-value for which is $2.53\times 10^{-5}$ (the two tailed p-value is twice that)
(with continuity correction, Z = 4.494)
You'd reject $H_0$ and conclude that property B is more likely with property A than without it.

