I have a problem: y~x1+x2+x3+x4 where the response variable y is always more than or equal to the explanatory variable x1 (for e.g. x1 represents the income of one person in a couple and y is the overall income of the couple). It seems that normal linear regression is inadequate in this case. What kind of regression models should I be looking into?
2 Answers
Linear regression may be appropriate.
You do not necessarily violate any of the following assumptions of linear regression:
The relationship between dependent and independent variables are linear ($y$ is roughly twice that of $x_1$ so check).
Errors terms are independent (you'll have to check this but there's no reason that $y$ always being more than or equal to $x_1$ would imply a violation).
Errors have constant variation across different levels of your explanatory variables, time, and predictions (again, you'll have to check this but there's no reason that $y$ always being more than or equal to $x_1$ would imply a violation).
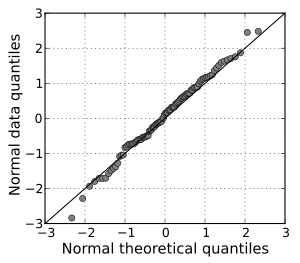
Errors are normally distributed. Here, your error terms are bounded below. That is, $\epsilon_i \geq x_1(1-\beta_1) - \beta_2x_2 - \beta_3x_3$. In practice, errors are very often not exactly normally distributed. The question is, can we say they are approximately normal? To check this, you may perform a formal test like the Shapiro-Wilk test (R function is shapiro.test) or you may plot a QQ plot. The QQ plot plots error terms versus what one would expect the error terms to be if normally distributed. If approximately normally distributed, the QQ plot should have error terms fall on a line. See below for a QQ plot which suggest normality.

Read more about Shapiro-Wilk Test: http://en.wikipedia.org/wiki/Shapiro%E2%80%93Wilk_test
Now, some other considerations:
What is the research question you have? Do you really need the income of one person in the couple in your model? Of course the income of one person in the couple is going to do a good job explaining the income of the entire couple. You may want to consider redefining your Y variable as income of person 1 in the couple and $x_1$ as income of person 2 in the couple.
Check to see if there are a lot of couples where only one person has income in your data. If so, you ought to consider adding a categorical variable for if $Y\neq x_1$ and an interaction effct. So, your model would look like this: $Y=\beta_1 x_1 + \beta_2x_2 + \beta_3x_3 + \beta_4x_4 + \beta_5x_1x_4$ where $x_4$ equals 1 if $Y \neq x_1$ and 0 otherwise. Basically, this allows for different linear relationships between $x_1$ and Y depending on whether or not $Y=x_1$.
-
$\begingroup$ This answer is pretty misleading. The relationship between the outcome and the variables is patently nonlinear: $\mathbb{E}(Y_i \mid X_{1i},\ldots, X_{4i}) = \max(X_{1i}, \sum_{k=1}^4 \beta_k X_{ik})$ (which is the only thing that matters for consistency of the OLS estimates, serial correlation and homoskedasticity are correctable deviations, and normality of errors is completely irrelevant). $\endgroup$ Commented Dec 14, 2013 at 12:20
You have a case of data-dependent truncated regression model, which is easily handled by the R package truncreg.
Here is some code that simulates such data, and then estimates the parameters of it:
library(truncnorm)
library(truncreg)
truncPoints = rnorm(100)
vBeta = c(1, 3, 6)
mX =  matrix(rnorm(100*3), nrow = 100)
vY = rtruncnorm(100, a=truncPoints,
                b=Inf,
                mean = truncPoints + mX %*% vBeta,  # mean of the truncated normal
                sd = 1)


truncreg(vY ~ mX, point = truncPoints)
