5
$\begingroup$

I have two distributions which are derived from 2 separate sets of data. These distributions are not normal, and it is not clear at this point if they belong to any family of known pdfs (they are not symmetric either). Given a data point, I need to decide which distribution it is most likely to belong to. If these were normal distributions, I could do usual parametric tests and go from there, but in this case I am not sure how to proceed. I searched around a bit, but I couldn't find anything, probably because I am not using the right keywords. Any help is much appreciated.

Edit to clarify: I should have mentioned that it was univariate. I might as well explain the actual problem here as well. We have time-spent data for users on websites. We also have information on whether a user liked or disliked some of those sites (about 4% of all the sites). So we know the distribution of time spent for like and dislike. An obvious question, then, is for a random user who spent x amount of time, are they more likely to have liked the page or dislike the page. Our time spent information is based on seconds, so the distributions are really discreet, but in real life, they are continuous.

$\endgroup$
5
  • 2
    $\begingroup$ the two datasets, how many variables do they have (are they each univariate)? $\endgroup$
    – user603
    Commented Jan 25, 2014 at 9:58
  • $\begingroup$ have you tried a logit model of like on time spent? $\endgroup$
    – user603
    Commented Jan 25, 2014 at 17:35
  • $\begingroup$ I have not. It would be great if you could point me in the right direction. $\endgroup$
    – delmet
    Commented Jan 25, 2014 at 18:46
  • $\begingroup$ Actually, never mind, I know what you are talking about, but the reason I did not want to get into more complicated models is that this need to be integrated to an existing framework on production, and simpler is better from that point of view. $\endgroup$
    – delmet
    Commented Jan 25, 2014 at 18:59
  • $\begingroup$ in this case, a logit will be a 3 parameter model. I don't see how you can make it simpler than that. $\endgroup$
    – user603
    Commented Jan 26, 2014 at 14:46

3 Answers 3

8
$\begingroup$

(My answer looks like I am assuming univariate distributions, but the underlying ideas carry over to the case with more variates.)

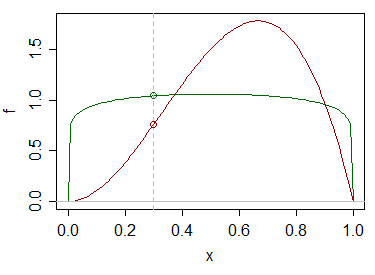
If you had population distributions ($F$, $G$) rather than samples and a point $x_{new}$, you could compare the height of the density (or probability function in the case of discrete random variables) to find the distribution with the greater likelihood of producing the observation. i.e. compare $f(x_{new})$ with $g(x_{new})$.

enter image description here

However, you only have samples. With large samples, you could make some assumptions (such as "the original population densities are smooth") and use (say) kernel density estimates* ($\hat f$ and $\hat g$), and then compare heights of those at $x_{new}$ - though of course the estimated probabilities are dependent on things like your choice of bandwidth and kernel, and are subject to random variation (a new sample would result in different relative density estimates at each $x$, though in large random samples they should be looking something like the population densities).

* or logspline density estimates, or whatever

There are some other things you might do but it will pretty much boil down to 'what are you prepared to assume?'

(Or did you want to take a Bayesian approach?)

$\endgroup$
3
  • $\begingroup$ I have edited my question for clarity. I would be grateful if you could sketch what the bayesian approach would look like. $\endgroup$
    – delmet
    Commented Jan 25, 2014 at 16:14
  • $\begingroup$ There's not a 'the', because there's more than one way to approach it as a Bayesian, but the direct Bayesian equivalent to the above analysis would compare posterior probabilities rather than likelihoods, by taking account your relative amount of prior belief in which distribution the allocation should go to at each observation (which again boils down to comparing two numbers, but they're scaled from the likelihoods). You could draw a similar picture. ...(ctd) $\endgroup$
    – Glen_b
    Commented Jan 25, 2014 at 22:25
  • $\begingroup$ (ctd)... Or, depending on what you needed to get out of it, you might simply allocate a probability to each point, or simply allocate that proportion of each point. By comparison, a Bayesian decision-theoretic approach would go further by starting with a loss-function (e.g. a function giving the relative cost - in whatever sense of the word you wanted - of misallocation of the point) $\endgroup$
    – Glen_b
    Commented Jan 25, 2014 at 22:29
1
$\begingroup$

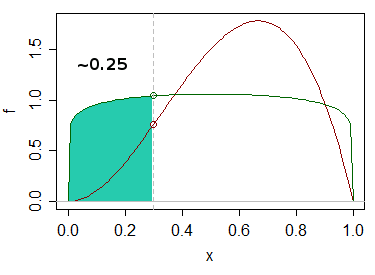
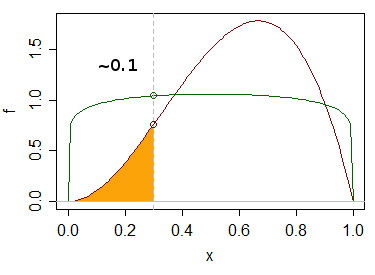
Being not a professional statistician, I see situation as this. We have two (or more) overlapping distributions. The task often appears in spectroscopy. So here you have approximately 0.25 probability belonging to one distribution and 0.1 to another respectively.

enter image description here

enter image description here

$\endgroup$
0
$\begingroup$

I am trying to solve an completely analogous problem. What I have started using as a basic approach is hypothesis testing.

If both the distributions are fairly spaced out, then you can check if the data point lies outside the bottom 95 percentile of the data of disliked websites. If it does, you can conclude with an error of 5% that the user liked the website. Similarly if the data point lies outside the top 95 percentile of the data of the liked websites, you can say that the user disliked the website.

This way you can get a a number "d" and another "l". If the time spent is below d, they disliked and if the time spent is above l, they liked. What to do between d and l is something even I want to know. ie, we have never used the value of the expected mixture (approx 4% people dislike the website) and neither am I able to use it in my problem.

$\endgroup$

Your Answer

By clicking “Post Your Answer”, you agree to our terms of service and acknowledge you have read our privacy policy.

Not the answer you're looking for? Browse other questions tagged or ask your own question.