0
$\begingroup$

I computed a feature x that I use to predict y which is a probability of being a certain class.

Raw data in R format for (x,y) is pasted here: http://tny.cz/a97b3fd0 (500 samples)

plot(x,y) looks like this:
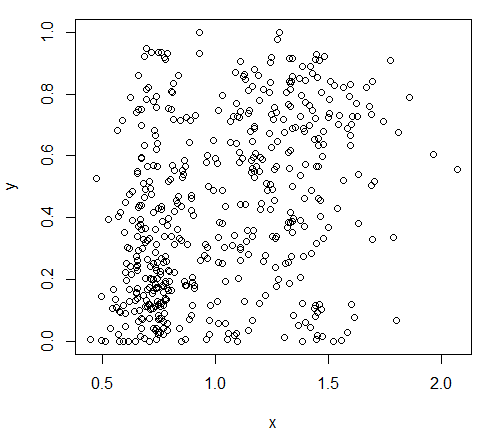
enter image description here

It seems similar to a previous question I asked, so I am tempted to try this advice, which I understand is the "Least Squared Fit"on log(y) (because y is a probability).

Am I correct?

(My objective is to minimize the MSE.)

$\endgroup$
3
  • $\begingroup$ Yes, clearly similar. In fact, what's different? Seems like the exact same story, at first glance. (And it's not log(y), it's the log odds.) $\endgroup$ Commented Jan 29, 2014 at 16:50
  • $\begingroup$ @Aaron x is different. Thanks for pointing out about the log odds. $\endgroup$ Commented Jan 29, 2014 at 17:00
  • 1
    $\begingroup$ Huh? x is different how? Tell us the story of the data, and how the story is different. $\endgroup$ Commented Jan 29, 2014 at 17:25

0

Browse other questions tagged or ask your own question.