15
$\begingroup$

In a variation on the coupon collector's problem, you don't know the number of coupons and must determine this based on data. I will refer to this as the fortune cookie problem:

Given an unknown number of distinct fortune cookie messages $n$, estimate $n$ by sampling cookies one at a time and counting how many times each fortune appears. Also determine the number of samples necessary to get a desired confidence interval on this estimate.

Basically I need an algorithm that samples just enough data to reach a given confidence interval, say $n \pm 5$ with $95\%$ confidence. For simplicity, we can assume that all fortunes appear with equal probability/frequency, but this is not true for a more general problem, and a solution to that is also welcome.

This seems similar to the German tank problem, but in this instance, fortune cookies are not labeled sequentially, and thus have no ordering.

$\endgroup$
4
  • 1
    $\begingroup$ Do we know the messages are equally frequent? $\endgroup$
    – Glen_b
    Commented Feb 22, 2014 at 11:00
  • $\begingroup$ edited question: Yes $\endgroup$
    – goweon
    Commented Feb 22, 2014 at 11:03
  • 2
    $\begingroup$ Can you write down the likelihood function? $\endgroup$
    – Zen
    Commented Feb 22, 2014 at 16:41
  • 3
    $\begingroup$ People doing wildlife studies capture, tag, and release animals. They later infer the size of the population based on the frequency with which they recapture already tagged animals. It sounds like your problem is mathematically equivalent to theirs. $\endgroup$ Commented Feb 25, 2014 at 19:17

3 Answers 3

7
$\begingroup$

For the equal probability/frequency case, this approach may work for you.

Let $K$ be the total sample size, $N$ be the number of different items observed, $N_1$ be the number of items seen exactly once, $N_2$ be the number of items seen exactly twice, $A=N_1(1− {N_1 \over K} )+2N_2,$ and $\hat Q = {N_1 \over K}.$

Then an approximate 95% confidence interval on the total population size $n$ is given by

$$ \hat n_{Lower}={1 \over {1-\hat Q+{1.96 \sqrt{A} \over K} }}$$

$$\hat n_{Upper}={1 \over {1-\hat Q-{1.96 \sqrt{A} \over K} }}$$

When implementing, you may need to adjust these depending on your data.

The method is due to Good and Turing. A reference with the confidence interval is Esty, Warren W. (1983), "A Normal Limit Law for a Nonparametric Estimator of the Coverage of a Random Sample", Ann. Statist., Volume 11, Number 3, 905-912.

For the more general problem, Bunge has produced free software that produces several estimates. Search with his name and the word CatchAll.

$\endgroup$
4
  • 1
    $\begingroup$ I took the liberty of adding the Esty reference. Please double check it's the one you meant $\endgroup$
    – Glen_b
    Commented Mar 1, 2016 at 0:03
  • $\begingroup$ Is it possible @soakley to get bounds (probably less precise bounds) if you only know $K$ (sample size), and $N$ (number of unique items seen)? i.e. we don't have information about $N_1$ and $N_2$. $\endgroup$
    – Basj
    Commented Nov 7, 2017 at 0:45
  • $\begingroup$ I don't know of a way to do it with just $K$ and $N.$ $\endgroup$
    – soakley
    Commented Nov 7, 2017 at 18:35
  • $\begingroup$ I think you need to multiply $\hat n$ with K, since the denominator is Good's coverage. $\endgroup$
    – Labo
    Commented Jan 7, 2022 at 12:17
4
$\begingroup$

Likelihood function and probability

In an answer to a question about the reverse birthday problem a solution for a likelihood function has been given by Cody Maughan.

The likelihood function for the number of fortune cooky types $m$ when we draw $k$ different fortune cookies in $n$ draws (where every fortune cookie type has equal probability of appearing in a draw) can be expressed as:

$$\begin{array}{} \mathcal{L}(m \, \vert \, k,n ) = m^{-n} \frac{m!}{(m-k)!} \propto P(k \, \vert \, m,n) &=& m^{-n}\frac{m!}{(m-k)!} \cdot \underbrace{S(n,k)}_{\begin{subarray}{l}\text{Stirling number }\\ \text{of the 2nd kind}\end{subarray}}\\ &=& m^{-n}\frac{m!}{(m-k)!} \cdot \frac{1}{k!} \sum_{i=0}^k {(-1)^{i}{k \choose i}}{(k-i)^n} \\ &=& {{m}\choose{k}} \sum_{i=0}^k {(-1)^{i}{k \choose i}}{\left(\frac{k-i}{m}\right)^n} \end{array}$$

For a derivation of the probability on the right hand side see the the occupancy problem. This has been described before on this website by Ben. The expression is similar to the one in the answer by Sylvain.

Maximum likelihood estimate

We can compute first order and second order approximations of the maximum of the likelihood function at

$$m_1 \approx \frac{ {{n}\choose{2}}}{n-k}$$

$$m_2 \approx \frac{ {{n}\choose{2}} + \sqrt{{{n}\choose{2}}^2 - 4(n-k) {{n}\choose{3}}}}{2(n-k)}$$

Likelihood interval

(note, this is not the same as a confidence interval see: The basic logic of constructing a confidence interval)

This remains an open problem for me. I am not sure yet how to deal with the expression $m^{-n} \frac{m!}{(m-k)!}$ (of course one can compute all values and select the boundaries based on that, but it would be more nice to have some explicit exact formula or estimate). I can not seem to relate it to any other distribution which would greatly help to evaluate it. But I feel like a nice (simple) expression could be possible from this likelihood interval approach.

Confidence interval

For the confidence interval we can use a normal approximation. In Ben's answer the following mean and variance are given:

$$\mathbb{E}[K] = m \left(1-\left(1 - \frac{1}{m}\right)^n\right)$$ $$\mathbb{V}[K] = m \left(\left(m-1\right)\left(1-\frac{2}{m}\right)^n + \left(1 - \frac{1}{m}\right)^n - m \left(1 - \frac{1}{m}\right)^{2n} \right)$$

Say for a given sample $n=200$ and observed unique cookies $k$ the 95% boundaries $\mathbb{E}[K] \pm 1.96 \sqrt{\mathbb{V}[K]}$ look like:
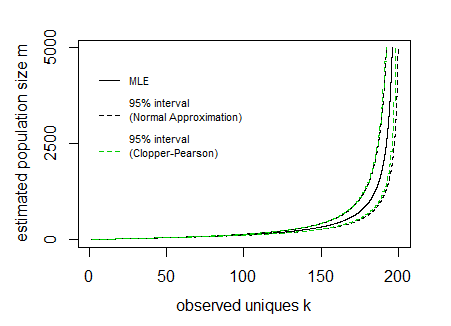
confidence interval boundaries

In the image above the curves for the interval have been drawn by expressing the lines as a function of the population size $m$ and sample size $n$ (so the x-axis is the dependent variable in drawing these curves).

The difficulty is to inverse this and obtain the interval values for a given observed value $k$. It can be done computationally, but possibly there might be some more direct function.

In the image I have also added Clopper Pearson confidence intervals based on a direct computation of the cumulative distribution based on all the probabilities $P(k \, \vert \, m,n)$ (I did this in R where I needed to use the Strlng2 function from the CryptRndTest package which is an asymptotic approximation of the logarithm of the Stirling number of the second kind). You can see that the boundaries coincide reasonably well, so the normal approximation is performing well in this case.

# function to compute Probability
library("CryptRndTest")
P5 <- function(m,n,k) {
  exp(-n*log(m)+lfactorial(m)-lfactorial(m-k)+Strlng2(n,k))
}
P5 <- Vectorize(P5)

# function for expected value 
m4 <- function(m,n) {
  m*(1-(1-1/m)^n)
}

# function for variance
v4 <- function(m,n) {
  m*((m-1)*(1-2/m)^n+(1-1/m)^n-m*(1-1/m)^(2*n))
}


# compute 95% boundaries based on Pearson Clopper intervals
# first a distribution is computed
# then the 2.5% and 97.5% boundaries of the cumulative values are located
simDist <- function(m,n,p=0.05) {
  k <- 1:min(n,m)
  dist <- P5(m,n,k)
  dist[is.na(dist)] <- 0
  dist[dist == Inf] <- 0
  c(max(which(cumsum(dist)<p/2))+1,
       min(which(cumsum(dist)>1-p/2))-1)
}


# some values for the example
n <- 200
m <- 1:5000
k <- 1:n

# compute the Pearon Clopper intervals
res <- sapply(m, FUN = function(x) {simDist(x,n)})


# plot the maximum likelihood estimate
plot(m4(m,n),m,
     log="", ylab="estimated population size m", xlab = "observed uniques k",
     xlim =c(1,200),ylim =c(1,5000),
     pch=21,col=1,bg=1,cex=0.7, type = "l", yaxt = "n")
axis(2, at = c(0,2500,5000))

# add lines for confidence intervals based on normal approximation
lines(m4(m,n)+1.96*sqrt(v4(m,n)),m, lty=2)
lines(m4(m,n)-1.96*sqrt(v4(m,n)),m, lty=2)
# add lines for conficence intervals based on Clopper Pearson
lines(res[1,],m,col=3,lty=2)
lines(res[2,],m,col=3,lty=2)

# add legend
legend(0,5100,
       c("MLE","95% interval\n(Normal Approximation)\n","95% interval\n(Clopper-Pearson)\n")
       , lty=c(1,2,2), col=c(1,1,3),cex=0.7,
       box.col = rgb(0,0,0,0))
$\endgroup$
1
  • 1
    $\begingroup$ For the case of unequal probabilities. You can approximate the number of cookies of a particular type as independent Binomial/Poisson distributed variables and describe whether they are filled or not as Bernouilli variables. Then add together the variance and means for those variables. I guess that this is also how Ben derived/approximated the expectation value and variance. ----- A problem is how you describe these different probabilities. You can not do this explicitly since you do not know the number of cookies. $\endgroup$ Commented Jan 8, 2020 at 17:03
2
$\begingroup$

I do not know if it can help but it is the problem of taking $k$ different balls during $n$ trials in an urn with $m$ balls labelled differently with replacement. According to this page (in french) if $X_n$ if the random variable counting the number of different balls the probability function is given by: $P(X_n = k) = {m \choose k} \sum_{i=0}^k {(-1)^{k-i}{k \choose i}}{(\frac{i}{m})^n}$

Then you can use a maximum likelihood estimator.

Another formula with proof is given here to solve the occupancy problem.

$\endgroup$

Your Answer

By clicking “Post Your Answer”, you agree to our terms of service and acknowledge you have read our privacy policy.

Not the answer you're looking for? Browse other questions tagged or ask your own question.