6
$\begingroup$

I take the bus to work and I am trying to make a prediction interval for the journey time to work so that I can leave the house and be 99% sure I will get to work on time. The journey has 2 parts.

  1. Waiting for the bus, the bus is meant to come every 10 minutes but because of traffic this varies a bit. I will assume that the waiting time follows an exponential distribution with a rate of 0.1 buses per minute. I call this variable X.

  2. The time spent on the the bus, I will assume this follows a normal distribution. I have taken some samples and have found the mean to be 53 minutes and standard deviation 2.4 minutes. The confidence interval of the mean is pretty small compared to the overall journey time so it is ok to assume that the population mean is equal to the sample mean. I call this variable Y.

So I am trying to create a prediction interval for the total time Z which is the sum of a normal and an exponential random variable. Z=X+Y. How can I go about doing this?

With the information I have I know the probability density functions are:

$f(x)=0.1e^{-0.1x}$

$g(y)=1.7\times 10^{-110} e^{9.471y-0.0893y^2}$

I don't mind if I have to use numerical integration but I'm not sure how to set up the integral when there are multiple variables.

$\endgroup$
5
  • $\begingroup$ My apologies, I'm new here and it doesn't allow new users to comment unless you have 50+ reputation so I'll try to answer your question but if it's not clear, please let me know. It seems that you want to find out the time you have to leave the house to get to work on time. Is it correct? Usually, the way statistics work is you have a sample of data and you make an inference on the parameters of your model but NOT on your random variable i.e. the travel time Z. For example, in your case, you can make an inference and build a 99% confidence interval for the rate in exponential distribution and $\endgroup$ Commented Mar 18, 2014 at 15:58
  • $\begingroup$ Is there any uncertainty in the estimates of the means and the standard deviation (as would usually be the case when dealing with something labelled 'prediction interval'), or is this simply a question about convolution? How did you arrive at the constant in $g$? $\endgroup$
    – Glen_b
    Commented Mar 18, 2014 at 19:57
  • $\begingroup$ Is your question more "how do I set up convolution integrals?" or "what are good ways to solve this specific problem, by any means?" $\endgroup$
    – Glen_b
    Commented Mar 18, 2014 at 20:37
  • $\begingroup$ @Glen_b Thank you very much for your help, I was assuming that they are independent and that there are no errors in the sample parameters (since the error appears negligible). That wikipedia article will be a great asset, I did not know that there was a name for this specific interval! $\endgroup$
    – Hugh
    Commented Mar 18, 2014 at 22:34
  • $\begingroup$ user25299 please only use answers to provide answers to questions (there are perhaps a few exceptions, as when a very extensive comment too long for the comment format is also at least a partial answer). This is a comment (I believe you have the privilege to comment in your own posts). Or it could also be an edit to your question, since it serves to clarify aspects of your question. $\endgroup$
    – Glen_b
    Commented Mar 19, 2014 at 1:10

2 Answers 2

5
$\begingroup$

You don't explicitly state in your question whether you're prepared to assume independence of the two times, but some things about the way you wrote your question do seem to suggest it. I'm not at all sure that is a reasonable assumption, since if traffic turns bad, the average wait and the average trip will be longer, in both cases because the buses will tend to be delayed.

Nonetheless, I have written the rest of this under the assumption that you intended the question to apply to the situation where they're independent.

The convolution of a normal and an exponential has what is sometimes called an Exponentially modified Gaussian (ExGaussian) distribution.

Some ExGaussians are skewed, others are very nearly normal.

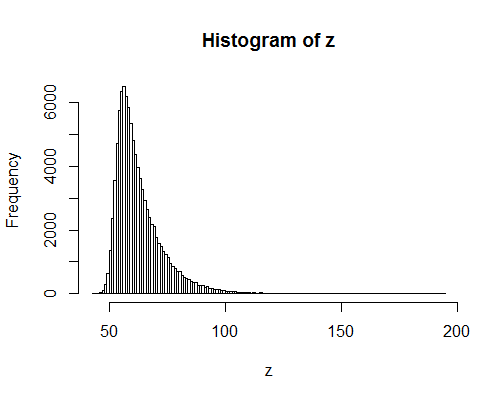
With your particular parameters, the distribution of the sum is not very close to normal. Here's a histogram of simulated values (100,000 of them) for the sum:

enter image description here

The mean and variance of the sum is easy - the mean is the sum of the means, and for independent variables, the variance is the sum of the variances; but this is not much use for getting the 99th percentile.

Incidentally, the same simulation above can be used to get a pretty good estimate of the 99th percentile:

The results from five simulations (of 1,000,000 values of $X+Y$ each) give 99.31, 99.23, 99.20, 99.26, 99.45 minutes respectively; if you need more accuracy, more simulations would be needed -- or actually finding the argument of the CDF that gives 0.99 (the CDF is given at the link to the ExGaussian I gave above).

A little trial and error with that CDF gives the value 99.34 minutes for the 99th percentile, which seems to be consistent with the simulations (and vice-versa).

(If you allow for even some mild positive dependence between the two times, it's going to go over 100 minutes.)

$\endgroup$
2
$\begingroup$

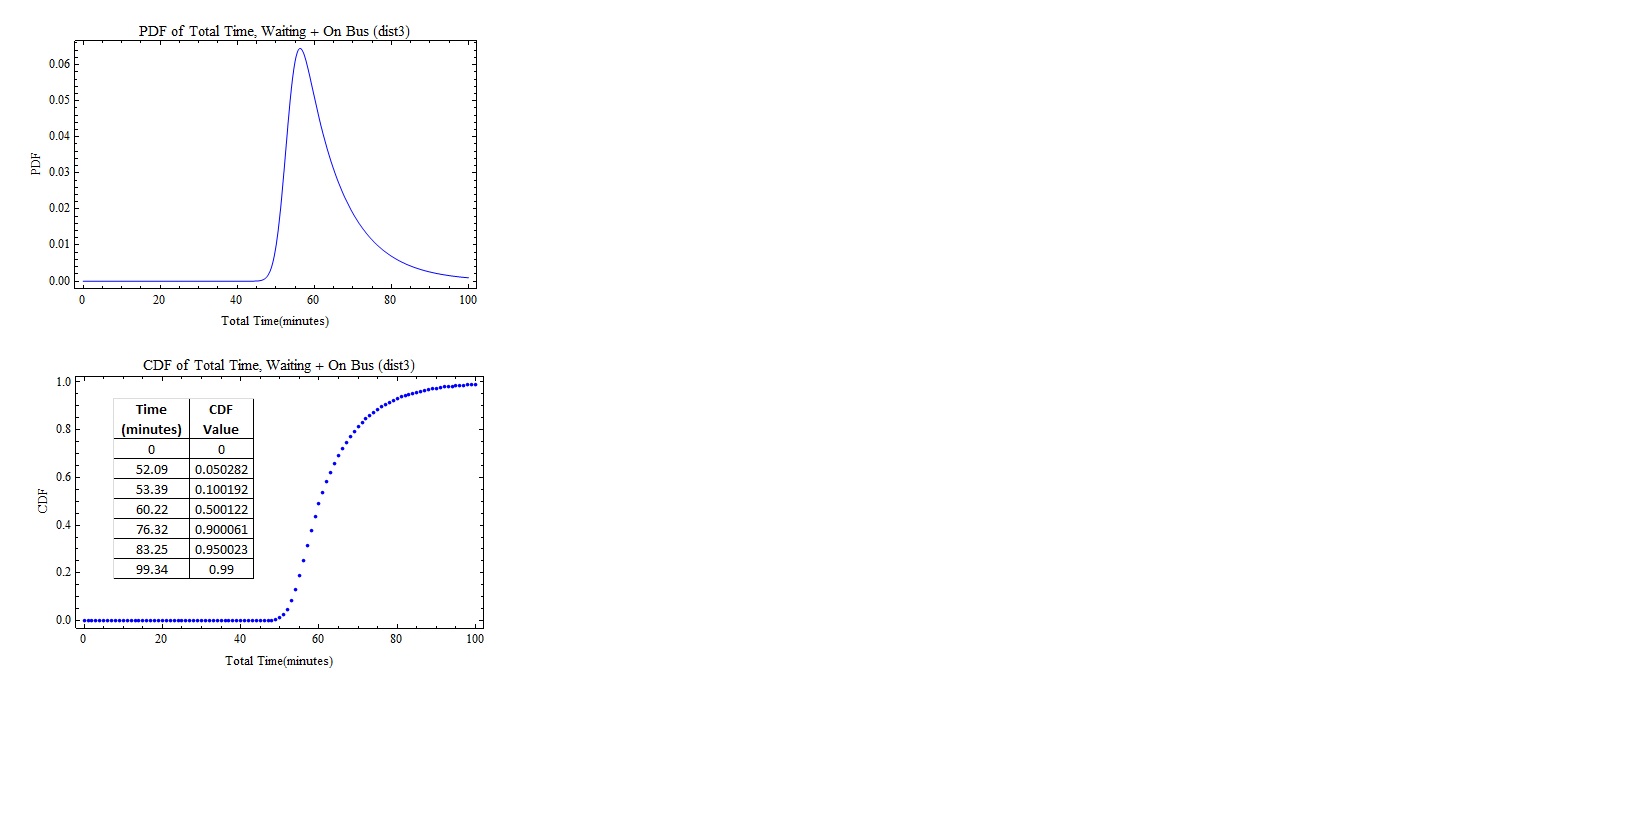
As indicated above by Glen_b, 99.34 minutes is the 99th percentile.

Below are the density(PDF) and cumulative distribution (CDF) plots and a table of CDF values for the combined distribution.

Output

$\endgroup$

Your Answer

By clicking “Post Your Answer”, you agree to our terms of service and acknowledge you have read our privacy policy.

Not the answer you're looking for? Browse other questions tagged or ask your own question.