It is trivial to create a boxplot in R with a full dataset. However, with limited access to the whole dataset, I just have 5 data point at min, 25%, 50% ,75%, and max. So is there any easy way to reproduce the boxplot with only these 5 values?
1 Answer
$\begingroup$
$\endgroup$
5
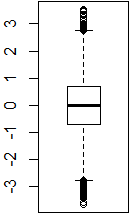
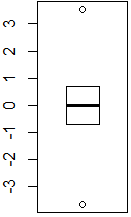
It's still pretty trivial. You can't reproduce the whiskers of a default boxplot effectively if the minimum and maximum values exceed Tukey's fences, but the box itself should remain unaltered. E.g., with x=rnorm(9999), compare boxplot(x) vs. boxplot(quantile(x)):
 $\leftarrow$ full dataset vs. your five values $\rightarrow$
-
2$\begingroup$
boxplot(fivenum(x))is a lot shorter thanboxplot(c(min(x),quantile(x,c(.25,.5,.75)),max(x)))(though if the quartiles don't match the definition of hinge infivenumthat might not be suitable) $\endgroup$– Glen_bCommented Apr 2, 2014 at 5:20 -
-
1$\begingroup$ See the edit to my comment; your original has the advantage of being able to use any of the 9 definitions of quantiles. Then again,
boxplot(quantile(x))would work in place of fivenum and probably matches the original post better; I'm just used to associating boxplots with fivenum. $\endgroup$– Glen_bCommented Apr 2, 2014 at 5:25 -
$\begingroup$ Wow. Never knew that one either! We'll go with that one then. $\endgroup$ Commented Apr 2, 2014 at 5:39
-
$\begingroup$ Yep. In large samples like that you can't see any difference between them, of course $\endgroup$– Glen_bCommented Apr 2, 2014 at 5:47

boxplot(your.five.data.points)? $\endgroup$