5
$\begingroup$

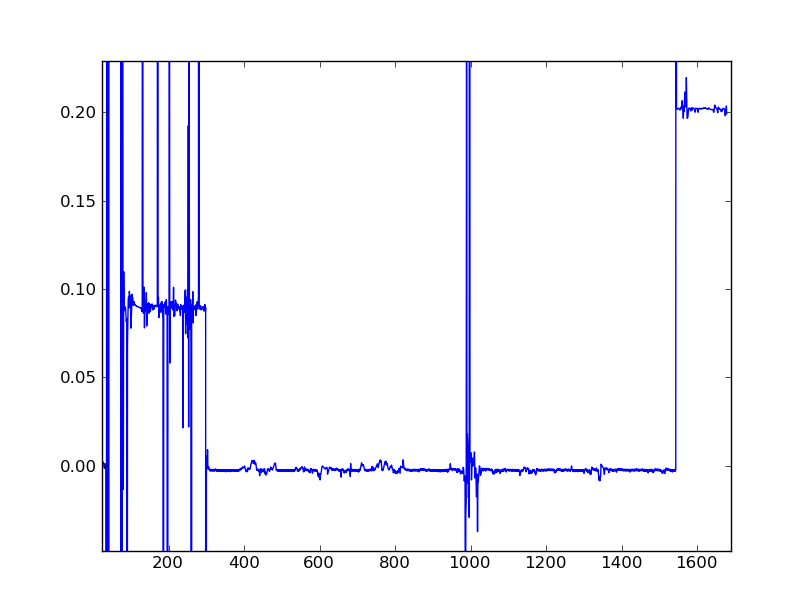
My new computer clock runs at a rate that changes in odd steps over time, even after I tuned it via the Linux adjtimex software. Here is a plot of the change in the cumulative clock drift for each of about 1700 samples taken every 10000 seconds, with a bunch of missed points and outliers when I was off the network and ntpdate wouldn't work. E.g. early on, the clock gained about 0.09 seconds every 10000 seconds (9 ppm).
clock-rate.png

I'm looking for some clever library functions that can automatically identify what I'll call the various statistical "modes" of this data set - i.e. there is one mode in the middle where y is about -0.02 for a long time, then another one near 0.09 early on and one at 0.202 at the end.

Most code for finding the mode of data that I've seen deals with integers and discrete data, but as you see this has pretty messy floating point values. At any rate, ideally I'd like a summary that automatically finds the modes I identified above, and also gives me a standard deviation for each. Start/stop points for each mode for extra credit. Python code preferred.

$\endgroup$
2
  • $\begingroup$ You can try running median for start. $\endgroup$
    – user88
    Commented Apr 18, 2011 at 7:36
  • $\begingroup$ @mbq Good point. My first fear was that the median might be some outlier in between real modes, so I'll need some technique to detect that. Also, given one mode, I wonder how best to identify the points that really are "nearby" that one, assuming a nice normal distribution. Finally I could subtract that set out and iterate by going back to look for the median again. $\endgroup$
    – nealmcb
    Commented Apr 18, 2011 at 13:47

2 Answers 2

2
$\begingroup$

I saw you said you prefer Python, but there are a bunch of R libraries for this, see Highest Density Region function: http://cran.r-project.org/web/packages/hdrcde/hdrcde.pdf

The second iteration of your looking for the median wouldn't work, as your modes would balance each other. Better off calculating the steepest points of ascent in the cdf.

$\endgroup$
1
2
$\begingroup$

Had to change my answer because I had trouble with strucchange, which doesn't seem to like hard changes. Maybe this code will help a bit.

library (robfilter)

# Make phoney data...
clock <- ts (rnorm (1000, 1, 0.03) * approx (1:10, rgamma (10, 1, 1, 1), seq (0.01, 10, 0.01), method="constant")$y)
spike <- round (runif (12, 1, 1000))
clock[spike] <- clock[spike] * 10

# Median filter, then difference...

clock.med <- med.filter (clock, 50)$level[,1]

clock.change <- abs (diff (clock.med))

plot (clock.change, type="l")

clock.med[clock.change > 0.15]
$\endgroup$
4
  • $\begingroup$ I really appreciate you providing a code snippet, and I do have great respect for R, but I use it so infrequently that I forget the basics. I eventually figured out that I need a library(strucchange) statement, but I'm still running into various odd errors with the format of clock. Can you make this a complete example, even if with only a tiny amount of uninteresting data? $\endgroup$
    – nealmcb
    Commented Apr 18, 2011 at 23:27
  • $\begingroup$ Thanks for the sample clock data and other updates. But I get an error on function "med.filter" not being found. Is that in a different library? $\endgroup$
    – nealmcb
    Commented Apr 23, 2011 at 5:29
  • $\begingroup$ Oops, forgot the library (robfilter). I believe it calculates medians for runs of at least 50 samples. $\endgroup$
    – Wayne
    Commented Apr 25, 2011 at 20:14
  • $\begingroup$ Oops, I lost track of this years ago! Thanks again, @wayne! Your sample data generator is clever. If I change the sign of your final comparison to clock.med[clock.change < 0.15] I can plot cleaned-up sections of relatively-stable data, but there are issues at the beginning and end of each because of the running medians. I'd guess it would be better to somehow use the high clock.change values to partition the data into sections, and do a straight median of each section, but I don't know how to do that. Ideally the output would be an array of just the stable section frequencies. $\endgroup$
    – nealmcb
    Commented Jan 16, 2019 at 19:30

Your Answer

By clicking “Post Your Answer”, you agree to our terms of service and acknowledge you have read our privacy policy.

Not the answer you're looking for? Browse other questions tagged or ask your own question.