26
$\begingroup$

Suppose we have $N$ measurable variables, $(a_1, a_2, \ldots, a_N)$, we do a number $M > N$ of measurements, and then wish to perform singular value decomposition on the results to find the axes of highest variance for the $M$ points in $N$-dimensional space. (Note: assume that the means of $a_i$ have already been subtracted, so $\langle a_i \rangle = 0$ for all $i$.)

Now suppose that one (or more) of the variables has significantly different characteristic magnitude than the rest. E.g. $a_1$ could have values in the range $10-100$ while the rest could be around $0.1-1$. This will skew the axis of highest variance towards $a_1$'s axis very much.

The difference in magnitudes might simply be because of an unfortunate choice of unit of measurement (if we're talking about physical data, e.g. kilometres vs metres), but actually the different variables might have totally different dimensions (e.g. weight vs volume), so there might not be any obvious way to choose "comparable" units for them.

Question: I would like to know if there exist any standard / common ways to normalize the data to avoid this problem. I am more interested in standard techniques that produce comparable magnitudes for $a_1 - a_N$ for this purpose rather than coming up with something new.

EDIT: One possibility is to normalize each variable by its standard deviation or something similar. However, the following issue appears then: let's interpret the data as a point cloud in $N$-dimensional space. This point cloud can be rotated, and this type of normalization will give different final results (after the SVD) depending on the rotation. (E.g. in the most extreme case imagine rotating the data precisely to align the principal axes with the main axes.)

I expect there won't be any rotation-invariant way to do this, but I'd appreciate if someone could point me to some discussion of this issue in the literature, especially regarding caveats in the interpretation of the results.

$\endgroup$
1
  • 4
    $\begingroup$ The problem itself usually is not rotation invariant, because each of the variables is recorded with a conventional unit of measurement appropriate to it. E.g, $a_1$ might be in feet, $a_2$ in microns, $a_3$ in liters, etc. Even when all units are the same, if the variables measure different kinds of things, the amounts by which they vary will likely differ in ways characteristic of those variables: once again, this is not rotation invariant. Therefore you should abandon rotation invariance as a guiding principle or consideration. $\endgroup$
    – whuber
    Commented Jun 22, 2011 at 19:28

4 Answers 4

13
$\begingroup$

The three common normalizations are centering, scaling, and standardizing.

Let $X$ be a random variable.

Centering is $$x_i^* = x_i-\bar{x}.$$

The resultant $x^*$ will have $\bar{x^*}=0$.

Scaling is $$x_i^* = \frac{x_i}{\sqrt{(\sum_{i}{x_i^2})}}.$$

The resultant $x^*$ will have $\sum_{i}{{{x_i^*}}^2} = 1$.

Standardizing is centering-then-scaling. The resultant $x^*$ will have $\bar{x^*}=0$ and $\sum_{i}{{{x_i^*}}^2} = 1$.

$\endgroup$
5
  • $\begingroup$ Can you define "SS" please? $\endgroup$
    – Szabolcs
    Commented Jun 22, 2011 at 7:53
  • $\begingroup$ Sum-of-squares. Sum of squared Xi. $\endgroup$
    – ttnphns
    Commented Jun 22, 2011 at 7:57
  • $\begingroup$ The reason for setting the sum of squares to 1, and not the variance, is that then the singular values will correspond to the standard deviations along the principal axes (unless I'm mistaken)? $\endgroup$
    – Szabolcs
    Commented Jun 22, 2011 at 8:08
  • $\begingroup$ Please also see my edit to the question. $\endgroup$
    – Szabolcs
    Commented Jun 22, 2011 at 8:13
  • $\begingroup$ @Szabolcs, I actually may miss a point of your edit. But PCA (or SVD) is just a rotation itself (a special case of orthogonal rotation of the axes). Any translation (like centering) or shrinking/dilatation (like scaling) of the cloud should affect the results of this rotation. $\endgroup$
    – ttnphns
    Commented Jun 22, 2011 at 8:40
8
$\begingroup$

You are absolutely right that having individual variables with very different variances can be problematic for PCA, especially if this difference is due to different units or different physical dimensions. For that reason, unless the variables are all comparable (same physical quantity, same units), it is recommended to perform PCA on the correlation matrix instead of covariance matrix. See here:

Doing PCA on correlation matrix is equivalent to standardizing all the variables prior to the analysis (and then doing PCA on covariance matrix). Standardizing means centering and then dividing each variable by its standard deviation, so that all of them become of unit variance. This can be seen as a convenient "change of units", to make all the units comparable.

One can ask if there might sometimes be a better way of "normalizing" variables; e.g. one can choose to divide by some robust estimate of variance, instead of by the raw variance. This was asked in the following thread, and see the ensuing discussion (even though no definite answer was given there):

Finally, you were worried that normalizing by standard deviation (or something similar) is not rotation invariant. Well, yes, it is not. But, as @whuber remarked in the comment above, there is no rotation invariant way of doing it: changing units of individual variables is not a rotation invariant operation! There is nothing to worry about here.

$\endgroup$
1
  • $\begingroup$ I get it for PCA. But is it also recommended to perform any kind of normalization before running Single Value Decomposition? $\endgroup$ Commented Dec 30, 2019 at 19:34
4
$\begingroup$

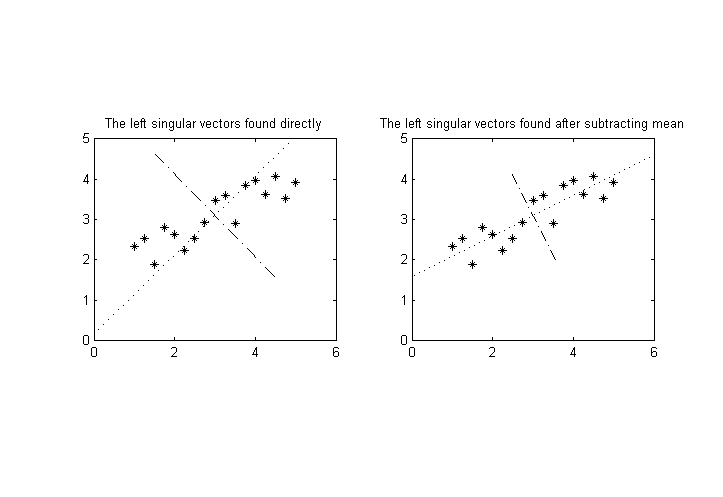
A common technique before applying PCA is to subtract the mean from the samples. If you don't do it, the first eigenvector will be the mean. I'm not sure whether you have done it but let me talk about it. If we speak in MATLAB code: this is

clear, clf
clc
%% Let us draw a line
scale = 1;
x = scale .* (1:0.25:5);
y = 1/2*x + 1;

%% and add some noise
y = y + rand(size(y));

%% plot and see
subplot(1,2,1), plot(x, y, '*k')
axis equal

%% Put the data in columns and see what SVD gives
A = [x;y];
[U, S, V] = svd(A);

hold on
plot([mean(x)-U(1,1)*S(1,1) mean(x)+U(1,1)*S(1,1)], ...
     [mean(y)-U(2,1)*S(1,1) mean(y)+U(2,1)*S(1,1)], ...
     ':k');
plot([mean(x)-U(1,2)*S(2,2) mean(x)+U(1,2)*S(2,2)], ...
     [mean(y)-U(2,2)*S(2,2) mean(y)+U(2,2)*S(2,2)], ...
     '-.k');
title('The left singular vectors found directly')

%% Now, subtract the mean and see its effect
A(1,:) = A(1,:) - mean(A(1,:));
A(2,:) = A(2,:) - mean(A(2,:));

[U, S, V] = svd(A);

subplot(1,2,2)
plot(x, y, '*k')
axis equal
hold on
plot([mean(x)-U(1,1)*S(1,1) mean(x)+U(1,1)*S(1,1)], ...
     [mean(y)-U(2,1)*S(1,1) mean(y)+U(2,1)*S(1,1)], ...
     ':k');
plot([mean(x)-U(1,2)*S(2,2) mean(x)+U(1,2)*S(2,2)], ...
     [mean(y)-U(2,2)*S(2,2) mean(y)+U(2,2)*S(2,2)], ...
     '-.k');
title('The left singular vectors found after subtracting mean')

As can be seen from the figure, I think you should subtract the mean from the data if you want to analyze the (co)variance better. Then the values will not be between 10-100 and 0.1-1, but their mean will all be zero. The variances will be found as the eigenvalues (or square of the singular values ). The found eigenvectors are not affected by the scale of a dimension for the case when we subtract the mean as much as the case when we do not. For instance, I've tested and observed the following that tells subtracting the mean might matter for your case. So the problem may result not from the variance but from the translation difference.

% scale = 0.5, without subtracting mean
U =

-0.5504   -0.8349
-0.8349    0.5504


% scale = 0.5, with subtracting mean
U =

-0.8311   -0.5561
-0.5561    0.8311


% scale = 1, without subtracting mean
U =

-0.7327   -0.6806
-0.6806    0.7327

% scale = 1, with subtracting mean
U =

-0.8464   -0.5325
-0.5325    0.8464


% scale = 100, without subtracting mean
U =

-0.8930   -0.4501
-0.4501    0.8930


% scale = 100, with subtracting mean
U =

-0.8943   -0.4474
-0.4474    0.8943

enter image description here

$\endgroup$
5
  • 1
    $\begingroup$ I should have mentioned in the question that the mean has already been subtracted. I'll edit it accordingly. $\endgroup$
    – Szabolcs
    Commented Jun 22, 2011 at 7:37
  • 1
    $\begingroup$ One might simply divide each variable by its standard deviation, but I was wondering if there are other things people do. For example, we can think of this dataset as a point cloud in $N$-dimensional space. Is there a way to do it in a way that does not depend on the rotation in this $N$-d space? If we divide by standard deviations, it will matter along which axes those standard deviations are taken (i.e. it's not rotation invariant). If we do it along the principal axes, then I think the variables will appear uncorrelated. $\endgroup$
    – Szabolcs
    Commented Jun 22, 2011 at 7:41
  • 1
    $\begingroup$ I realize there might not be a rotation-invariant way to do it, but I'd love to at least read some discussion of these issues ... any pointers welcome. Note: I have no training in applied stat (only maths, such as linalg, prob theory), so I'm learning this stuff as I'm going. $\endgroup$
    – Szabolcs
    Commented Jun 22, 2011 at 7:43
  • 2
    $\begingroup$ When you don't center the samples (subtract the means from the columns), the first eigenvector usually is not the vector of means. $\endgroup$
    – whuber
    Commented Jul 9, 2014 at 20:46
  • $\begingroup$ -1 Downvoted, because this answer is only about centering, whereas the question is about scaling. Also, the claim that the first eigenvector is necessarily the vector of means is wrong, as noted by @whuber. $\endgroup$
    – amoeba
    Commented Jan 20, 2015 at 0:08
-5
$\begingroup$

To normalizing the data for PCA, following formula also used

$\text{SC}=100\frac{X-\min(X)}{\max(X)-\min(X)}$

where $X$ is the raw value for that indicator for country $c$ in year $t$, and $X$ describes all raw values across all countries for that indicator across all years.

$\endgroup$
1
  • 7
    $\begingroup$ Who said anything about countries or years? $\endgroup$ Commented Jul 9, 2014 at 11:21

Your Answer

By clicking “Post Your Answer”, you agree to our terms of service and acknowledge you have read our privacy policy.

Not the answer you're looking for? Browse other questions tagged or ask your own question.