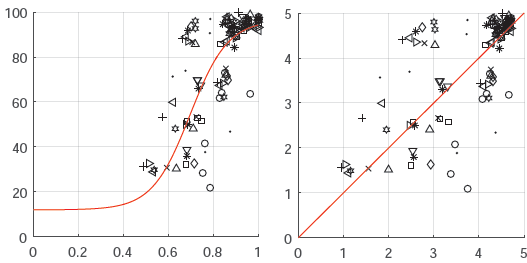
There's a figure attached to this post. The left hand side of the figure shows a graph with a polynomial fitting the data. The right hand side shows the same data plotted on a different scale but using the polynomial fit. I'm looking for the name of this process or graph produced by fitting a polynomial. I'm not referring to polyfitting or polynomial regression but rather the process or type of figure where the curved line has now become the central straight line and the values are scaled around it.
Secondary question that doesn't need to be answered: how can you produce these scaled values given a polynomial? (I plan to figure this out once I know the name of that kind of graph.)

