8
$\begingroup$

As the title suggests, I am having a bit of confusion on the effect of first order intensity function. If I have a first order intensity function that says in a certain region the points are much more likely to occur, that means there would be a lot more points occurring in that region and it would appear that the points are clustering in that region and subsequently suggests that in that region the point patterns are clustered. So it seems that inhomogeneity of the first order intensity affects the second order intensity.

My understanding is that the first order intensity function specify the general level of intensity at which the points occur. Then based on that intensity, whether points in a certain region are clustered or repulsive compared to a same intensity Poisson process is then determined by the second order intensity function.

If my understanding is correct, then any point pattern can be regarded as an inhomogeneous Poisson process if we describe the first order intensity as detailed as possible. But of course, that will be a case of overfitting.

Is this understanding correct?

$\endgroup$

2 Answers 2

4
$\begingroup$

First order intensity and second order intensity measure different aspects of a process that can be almost independently varied. In particular, not every point process can be regarded as an inhomogeneous Poisson process.

Let's deal with that last issue first. Consider a homogeneous Poisson process on the interval $[0,1].$ The gaps will tend to follow an exponential distribution. Let's compare it with a process that tends to maintain a more even spacing, a "stratified random" process. It is created by dividing the interval into a thousand non-overlapping bins and selecting one uniformly random point within each bin. They have the same first order intensities, as suggested by these estimates from a single realization of each process:
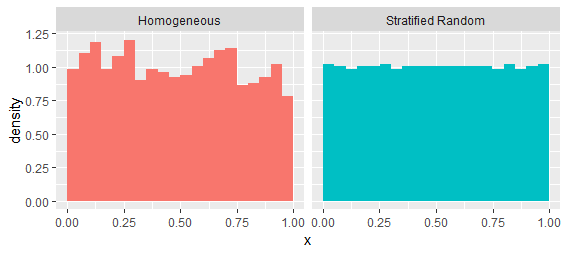
Figure 1

These processes are readily distinguished by examining the intervals between successive values:
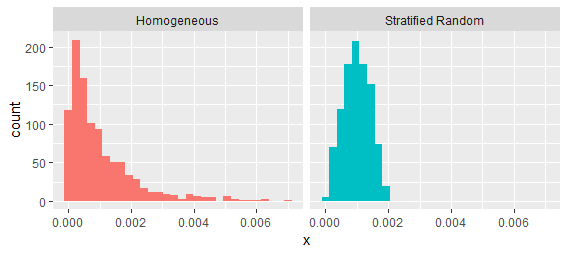
Figure 2

It is indeed the case that certain forms of "clustering" can be characterized by the second order intensity--but not all. Clustering can mean any combination of two things:

  1. "First order" clustering near a location $s$ just means there tend to be more points in a neighborhood of $s$ across all realizations.

  2. "Second order" clustering near a location $s$ means the appearance of a point close to $s$ is associated with the appearance of points at other locations near $s.$

This sounds subtle, so let's contrast some examples. I have generated realizations of two processes: one that is simply inhomogeneous, having an intensity five times greater on the interval $(0,1/2]$ than on the interval $(1/2,1]$; and another that is similarly inhomogeneous but clustered in the interval $(0,1/2]$. To generate the latter, I created a sequence of iid exponential variates $dX_i$, multiplied every fifth one of them by $100,$ and computed their cumulative sum $X_i,$ finally dividing by twice their sum to place them within the range $(0,1/2].$ The process in the interval $(1/2,1]$ is a homogeneous Poisson process, just as before. This created a process in which there tend to be tight groups of four points, all widely separated from each other. Because the intervening gaps between those points are random, though, the locations where those clusters occur tend not to be the same from one realization to another. When you have the opportunity to view multiple realizations of a process, this is one way to distinguish inhomogeneity (which will persist from one realization to the next) from clustering (which may occur anywhere, not necessarily at fixed locations).
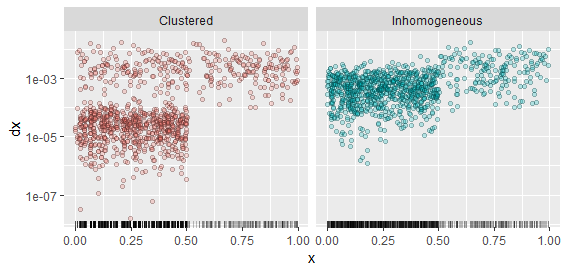
Figure 3

The realization of each process appears as a rug plot at the bottom. The points are a scatterplot of the $(X_i, dX_i)$ pairs: that is, the heights graph the gaps to the next point at the right. The scatterplots clearly distinguish the two processes.

$\endgroup$
6
  • $\begingroup$ Thanks for the reply. This certainly cleared out most of my confusions. However, it also creates another question for me and I want to get this right. From what you said, is it true that if I don't know the data generating process and I only have one realization of the point process, then the first order inhomogeneity and second-order dependence structure are always indistinguishable as mentioned by Ege? $\endgroup$ Commented Jun 5, 2019 at 0:50
  • $\begingroup$ I disagree with that conclusion, because an analysis of the nearest-neighbor gaps can help distinguish them. I would agree that in many cases it may be difficult to distinguish those phenomena, but it's definitely possible to do so in some cases. $\endgroup$
    – whuber
    Commented Jun 5, 2019 at 1:05
  • $\begingroup$ I guess I was not clear enough on what I meant. I meant if I only have one data set of a point process that I know nothing about, e.g., the clustered point process in your second example. It does seem to me that in this case there is no way I can distinguish first-order inhomogeneity and second-order dependence structure. Since it does seem possible for me to fit a very detailed first order intensity function to describe the process as well as the nearest neighbor gaps. That is of course overfitting. Nevertheless, it seems to prove my point. $\endgroup$ Commented Jun 5, 2019 at 1:29
  • 1
    $\begingroup$ I agree that with reasonable assumptions you can have some luck in using a single point pattern to separate inhomogeneity and "real" clustering (and more easily inhibition) due to interactions between points. However, you can always refer to the degenerate case and say that the underlying process is inhomogeneous Poisson with virtually point masses at the observed points, so in the mathematical sense without further assumptions I guess you cannot really make progress. Of course this is uninteresting from a practical point of view and not a point of view I'm advocating in any way. $\endgroup$
    – Ege Rubak
    Commented Jun 6, 2019 at 6:52
  • 1
    $\begingroup$ @Ege Thank you for that analysis. It strikes me that the extreme model you describe is a kind of high-parameter-count, "saturated" model that could be compared to other parsimonious models in standard ways (through AIC, cross-validation, etc), thereby making it possible to develop objective, informed opinions about the nature of the underlying process. $\endgroup$
    – whuber
    Commented Jun 6, 2019 at 13:45
2
$\begingroup$

In broad terms your understanding sounds right. In particular, you are right that it is basically impossible to distinguish "first order inhomogeneity" and "second order clustering due to interactions between points" based on a single point pattern.

$\endgroup$
2
  • $\begingroup$ Thanks a lot for the reply. If this is the case, is there a way to obtain a second order dependence statistics, e.g. Pair correlation function, after excluding the effect of the first order inhomogeneity (assuming I have use some model to describe the first order intensity) ? Furthermore, is there a general way to tell if the modelling of first order intensity function is an overfit? $\endgroup$ Commented Jun 4, 2019 at 7:30
  • $\begingroup$ It is hard to say anything in general about overfitting. To consider second order statistics such as the pair correlation function in presence of first order inhomogeneity is indeed possible. You need extra assumptions such as a form of pseudo-stationarity (second order intensity reweighted stationarity). There are details in (the free sample) Chapter 7 (specifically Section 7.10) of the spatstat book Disclaimer: I'm a co-author, so I'm biased in using this as a reference -- there are tons of other references. $\endgroup$
    – Ege Rubak
    Commented Jun 4, 2019 at 11:41

Your Answer

By clicking “Post Your Answer”, you agree to our terms of service and acknowledge you have read our privacy policy.

Not the answer you're looking for? Browse other questions tagged or ask your own question.