5
$\begingroup$

I am currently analyzing a point pattern in R using the "spatstat" package. My analyses are primarily exploratory, as I do not have any strong reason to suspect either clustering or regularity, though either might feasibly occur. My goal is to first determine if the pattern is characterized by complete spatial randomness, and if not, attempt to characterize whatever heterogeneities might exist.

One important note: the borders of my observation window are not arbitrary and have biological significance, and are of irregular shape. Points do not and cannot exist outside of the borders. As such, I am working with a "Small World Model" described in Baddeley's "Spatial Point Patterns: Methodology and Applications with R".

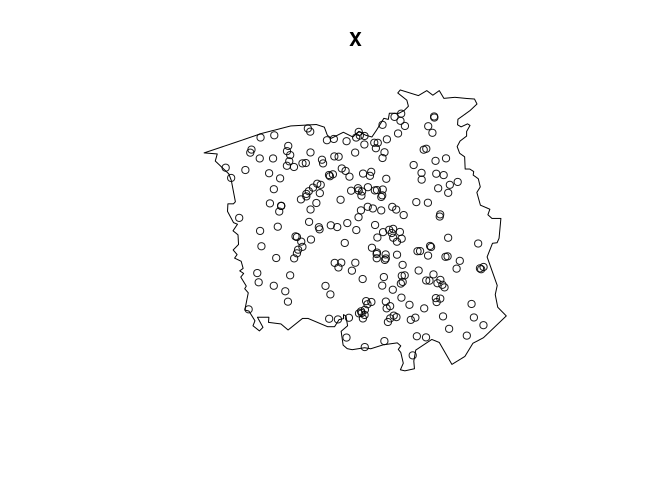
Here is an image of my point pattern:
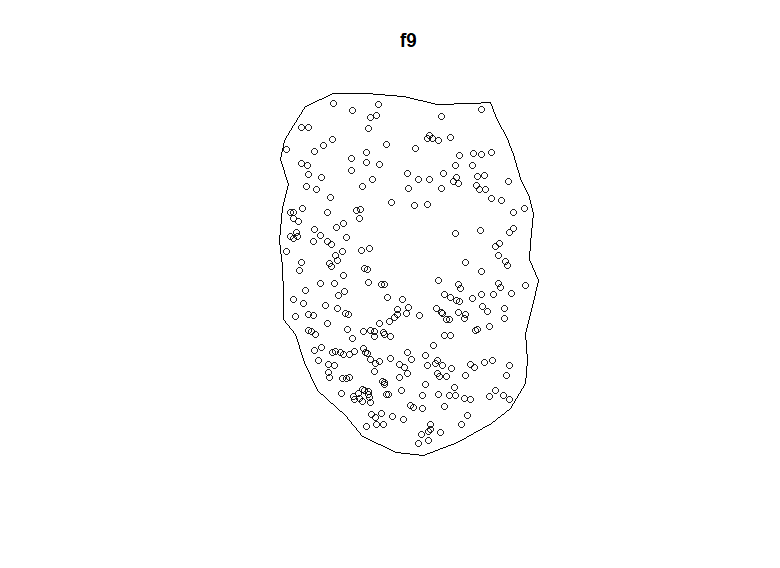
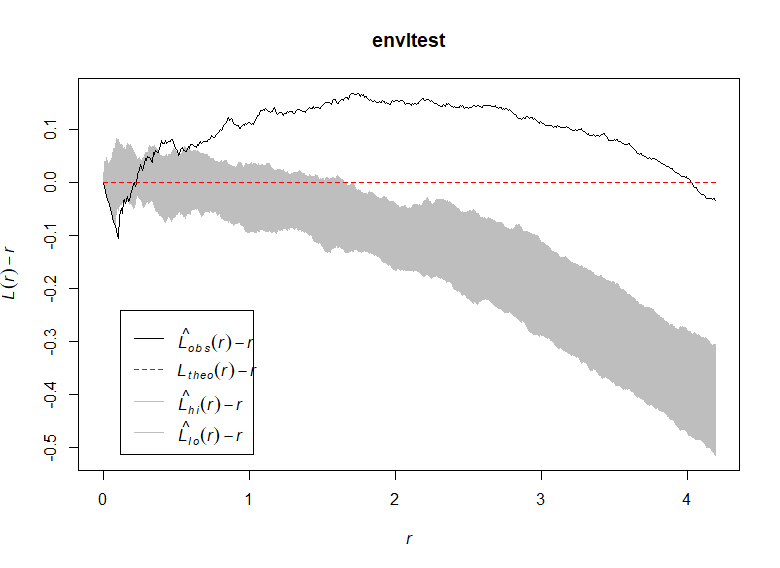
I first calculated the L function without any edge correction from the observed pattern and compared it to a homogenous Poisson process using simulation envelopes.

envltest <- envelope(f9, Lest, correction = "none", nsim = 39, savefuns = TRUE)

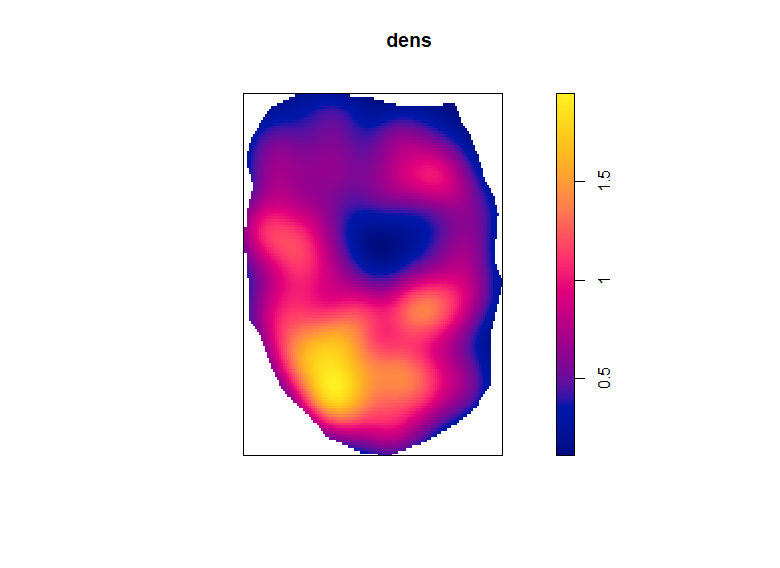
I also visually inspected the intensity of the point pattern using non-parametric kernel estimation.

dens <- density(f9, edge = FALSE, sigma = bw.ppl)

Concluding that the pattern was inhomogenous with potential clustering, I then calculated the inhomogenous L function with simulation envelopes using the following code:

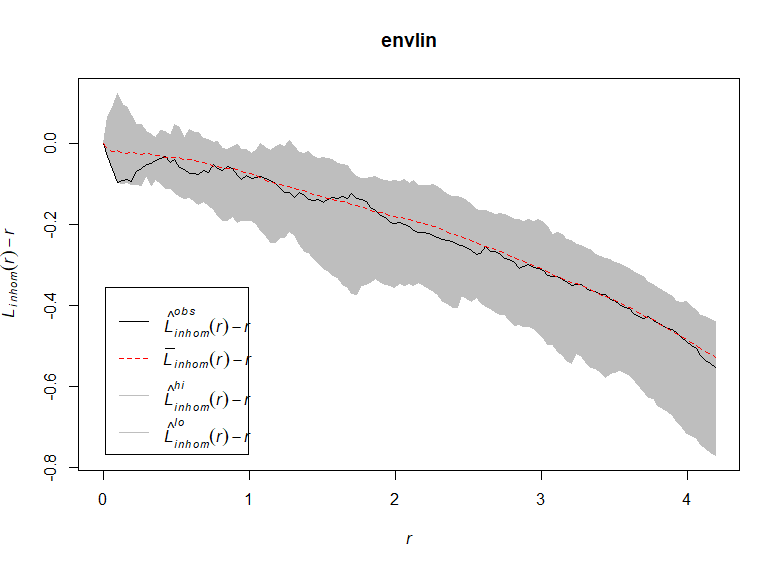
envlin <- envelope(f9, Linhom, simulate = expression(rpoispp(dens)), sigma = bw.ppl, edge = FALSE, correction = "none", nsim = 39, savefuns = TRUE)

Using the previously estimated density function (I have no environmental covariates that I could use to try and fit a parametric model), I generated a Poisson process with that intensity function using simulate = expression(rpoispp(dens)). My understanding is that the result is then passed to density.ppp, to which I also pass sigma = bw.ppl, edge = FALSE. The L function is then calculated from this simulation, and the process repeats. The following is the result:

From this I conclude that it is unlikely that the inhomogeneity I detected is a result of interpoint interactions that lead to clustering. However...

I also ran a Hopkins-Skellam Index test on this point pattern with hoptest <- hopskel.test(f9, method = "MonteCarlo", nsim = 999). The test indicates clustering (A = 0.74) with p-value = 0.018. I am now confused by these results and have a couple questions.

QUESTION #1: Does the "Small World Model" violate any assumptions of the Hopkins-Skellam Index that might cause such a test to spuriously suggest clustering?

QUESTION #2: If I have not violated any assumptions of the HS test, is it possible that the scale of environmental heterogeneity and the scale of interpoint interaction are too similar for me to detect the clustering?

QUESTION #3: From what you can see, is all of this confusion caused by something really stupid in my code...?

Thank you for any help you can offer!

$\endgroup$
1
  • 1
    $\begingroup$ Thank you for a thoughtful, clear question--and welcome to our site. $\endgroup$
    – whuber
    Commented Jan 9, 2019 at 14:51

1 Answer 1

4
$\begingroup$

I just want to chime in with @whuber and thank you for a well written question. I can add that the null hypothesis of the Hopkins-Skellam test is CSR, so your result is consistent with your other findings: Your pattern is not CSR. The apparent clustering could also be explained by inhomogeneity – even though the Hopkins-Skellam test should be less sensitive to this problem of distinguishing clustering and inhomogeneity it is still a problem. It may well be an inhomogeneous Poisson process that generated your pattern.

As an example of the problem consider an inhomogeneous Poisson process generated the following way, which in my experience always generates a highly significant clustered result with the Hopkins-Skellam test:

library(spatstat)
lambda <- density(chorley)/5
set.seed(42)
X <- rpoispp(lambda)
X <- X[Window(chorley)] ## Recreate polygonal window rather than digital mask
plot(X)

hopskel.test(X)
#> 
#>  Hopkins-Skellam test of CSR
#>  using F distribution
#> 
#> data:  X
#> A = 0.7524, p-value = 0.002046
#> alternative hypothesis: two-sided

However, to my surprise the p-value of the approximate test is quite different from the Monte Carlo test, so maybe simply setting method = "MonteCarlo" will give you another result and even yield non-significance in your case?

hopskel.test(X, method = "MonteCarlo") ## Takes a bit of time
#> 
#>  Hopkins-Skellam test of CSR
#>  Monte Carlo test based on 999 simulations of CSR with fixed n
#> 
#> data:  X
#> A = 0.70736, p-value = 0.018
#> alternative hypothesis: two-sided

Created on 2019-01-09 by the reprex package (v0.2.1)

$\endgroup$
6
  • $\begingroup$ +1 I would expect the Monte-Carlo test to give the more reliable result because there is little assurance the asymptotic distribution of the approximate test is very accurate. Indeed, repeating the approximate test (which is a nice example of a randomized test, with a different p-value each time) shows a wide variation in the test statistic: hist(sim <- replicate(5e2, hopskel.test(X)$statistic)) By using its mean as the test statistic you will get a result not significantly different from the Monte Carlo version. $\endgroup$
    – whuber
    Commented Jan 9, 2019 at 20:53
  • $\begingroup$ Good question and good answer. Correct me if I'm wrong but from my understanding there is no way to distinguish between heterogeneity and clustering processes based only on the point pattern. It could be heterogeneity in the intensity or some between-points process. Must one always use domain specific knowledge to get at this? $\endgroup$
    – ASeaton
    Commented Jan 15, 2019 at 16:06
  • $\begingroup$ Yes, distinguishing is in general not possible for a single point pattern. Given several patterns the situation is different when deciding between a homogeneous cluster process and an inhomogeneous process: If "clusters" appear consistently in the same areas it is consistent with spatial heterogeneity while the clusters appear randomly in different areas for cluster processes... $\endgroup$
    – Ege Rubak
    Commented Jan 15, 2019 at 20:43
  • $\begingroup$ Thank you, Ege Rubak, for taking the time to answer my question. I would like to add an additional inquiry. QUESTION: Could you describe in a bit more detail how you could leverage replicate data to tease apart inhomogeneity from homogenous cluster processes? And how/when would you decide when it is appropriate to try and use those methods? Would I have had to see deviation from the null in my inhomogenous L function before attempting to analyze clustering? $\endgroup$
    – Hobbes
    Commented Jan 15, 2019 at 21:16
  • $\begingroup$ ^Ege Rubak. "Correct" me if I am wrong, but one can potentially discern the difference between inhomogeneity and a cluster process by correcting for inhomogeneity (as described above). If, after correction, the summary function is still more clustered than expected (under the null of an inhomogeneous Poisson point process)..then that is evidence of clustering. From my own experience, the trick is in finding an accurate way to estimate intensity. Kernel smoothing can be problematic (it tends to over-correct). $\endgroup$ Commented Feb 20, 2019 at 20:15

Your Answer

By clicking “Post Your Answer”, you agree to our terms of service and acknowledge you have read our privacy policy.

Not the answer you're looking for? Browse other questions tagged or ask your own question.