2
$\begingroup$

I would appreciate some help in deciding the analysis method for my research.

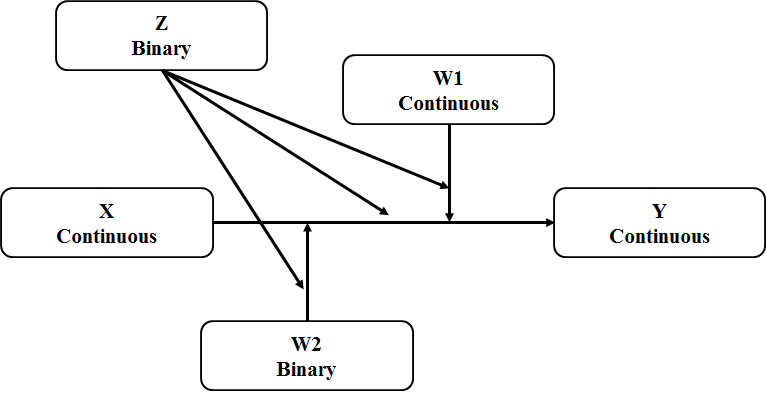
I have 7 variables: one DV, one IV, two moderators, one moderator/moderating moderator plus 2 controls. My overall sample size is 100 which is divided by the levels of Z (two countries) into 46 and 54. The DV, IV and one of the moderators are Likert-scale data (7 points), the other moderator and moderator/moderating moderator are binary.

My main purpose is to investigate the differences between the two countries regarding the relationships among the other variables.

enter image description here

I tried two analysis methods which I find okay but not sure which one is the best. The first one is regression analysis using R and the second is PLS-SEM using SmartPLS.

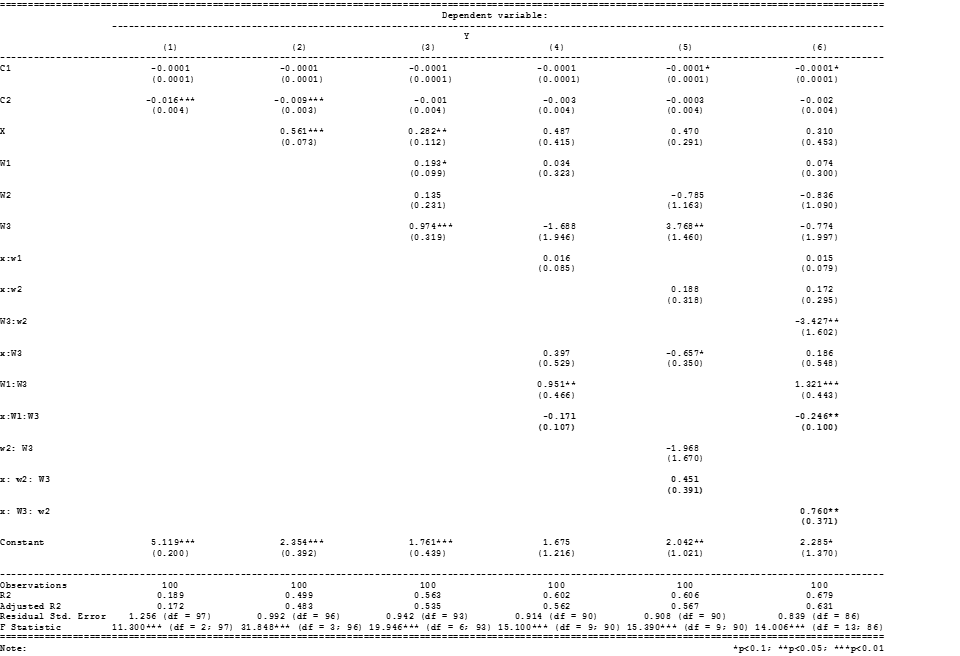
For the regression analysis, I ran the following models (ignore model 2): Note: W3 = Z m1 <- lm (Y ~ C1 + C2, data = DataR100C) m3 <- lm (Y ~ C1 + C2 + X + W1 + W2 + Z, data = DataR100C) m4 <- lm (Y ~ C1 + C2 + X*W1*Z, data = DataR100C) m5 <- lm (Y ~ C1 + C2 + X*W2*Z, data = DataR100C) m6 <- lm (Y ~ C1 + C2 + X*W1*Z + X*W2*Z, data = DataR100C)

The results are as follows:

enter image description here

First, I would like some help with the interpretation. I see that both 3-way interactions are significant when combined but not separately. what does this mean?!

For the second method; PLS-SEM, I added the two interaction terms to the model then ran bootstrapping analysis, then I ran MGA between the two countries (Z) to detect multigroup differences.

Which method is better to best present my main focus, having in mind the small sample size? are there other methods I should try?

Thanks.

$\endgroup$
2
  • $\begingroup$ Just a short comment. You are testing a fairly complex model for your sample size of n=100. You may run a risk of not having enough power to detect statistically significant effects, especially for the moderated parts of your model $\endgroup$ Commented Feb 5, 2020 at 14:16
  • $\begingroup$ Thank you for the comment @PsychometStats. Do you have any suggestions? $\endgroup$
    – S.Abdalla
    Commented Feb 6, 2020 at 3:49

1 Answer 1

1
$\begingroup$

@Sara, I will add some suggestions here, as I thought that it might be a bit too long for a comment. I apologise in advance that I will not be able to tackle all issues raised in your post. So hopefully, whatever is not covered will be covered by others.

First, given a complex model for your relatively small sample size of n = 100, you may lack statistical power to detect (especially) moderated effects. Hence, I would probably start by running the simplest X -> Y model. Once you have an idea of the relationship between these two variables, I would do the following.

You may start by adding moderators incrementally. The first choice is between W1 (binary), Z1 (binary) and W2(continuous). Again given your sample size, my recommendation would be to start by trying either of the binary moderators W1 or Z1. From a statistical point of view it's more convenient and generally easier to start with binary moderators. When guiding your choice as to which of the two binary moderators to start with, you may ask yourself which of the two makes theoretically more sense. If adding W1 or Z1 individually and then simultaneously does NOT work, and it is not unreasonable to expect that, I would then try adding W2 (continuous) moderator individually instead.

Next, try adding all 3 moderators simultaneously: W1, Z1 W2, and then assess the results. If everything happens to be significant, then your interpretation of the conditional effects would usually be complex as you need to go into details of various conditions under which X affects Y. For example, suppose W1 is gender, Z1 is disability, and W2 is age. Then you may say that, for example, that for middle age females without disability, X has a significant effect of Y (insert effect size and level of statistical significance). Again, you do not need to interpret the effects of X on Y for every possible condition, but rather for the conditions you may most be interested in.

Finally, I would add two remaining relationships: each where Z1 moderates the moderated effects of W1 and W2. Please note that in practice, relatively large sample sizes are needed to test hypotheses involving moderated moderation.

Again, my guess is that you would struggle to achieve statistically significant results for the moderated relationships, but it is not to say that you should NOT try. After all, this situation is not uncommon in social research. In such situations, if your moderated relationships are not significant, you may acknowledge a possibility in your write up that this might have been a result of low power (i.e. low sample size). And that this possibility may be tested in future research with larger sample sizes to get more conclusive results.

$\endgroup$

Your Answer

By clicking “Post Your Answer”, you agree to our terms of service and acknowledge you have read our privacy policy.

Not the answer you're looking for? Browse other questions tagged or ask your own question.