I am really new to R and to time series. My field of studies is in the field of Networks and Telecommunication, but my summer internship is about trying to find a statistical model for some sets of data.
The data consists of what is called "10-minutes-points", recorded over a year and which represent power consuption of a source substation. It means I have 6 * 24 * 365 = 52 560 points of data to process, one set for each source substation.
It's been about a week I'm trying to found information about ARIMA models. This website and the report of my predecessor quite helped me getting in the subject, by I still encountered many problems.
I found one might be due to the large size of the data set as explained here, the second one to the existence of exogenous data as mentioned there.
My predecessor found the ARIMA model to be effective for short term predictions (up to 20-ish hours), and the SARIMAX for mid-term predictions (around a dozen days). I guess it is cause exogeneous data doesn't affect as much the core data on such short periods of time.
I found this thread to be very interesting but I'm not sure I understand everything.
In a first time I would like to know if my understanding of the general method to evaluate a model is correct :
first you plot your data and try to look for any trend/seasonality (the data I have showed to have a daily seasonality and a yearly one)
you use log in order to reduce the trend, and maybe differentiate to eliminate the seasonality (so I should use something like :
diff(data.ts, 144)in my case to get rid of the daily seasonality (6*24 points a day) ?)plot the acf/pcf of the differentiated time series and try to estimate a model from there
try to fit the model to my data with
fit <- Arima(data, order=c(p,d,q), seasonal=c(P,D,Q))but I don't where the seasonality (144) would appear in this function ?study the residuals of fit to see if the model is correct (looking at the acf/pacf)
use fitted or forecast (I don't know which one is better) to predict future values
Thing is, since the data set is huge, I always get significant spikes at many lags in the acf/pacf and I don't feel I can judge if a model is correct or not.
Here is an example :
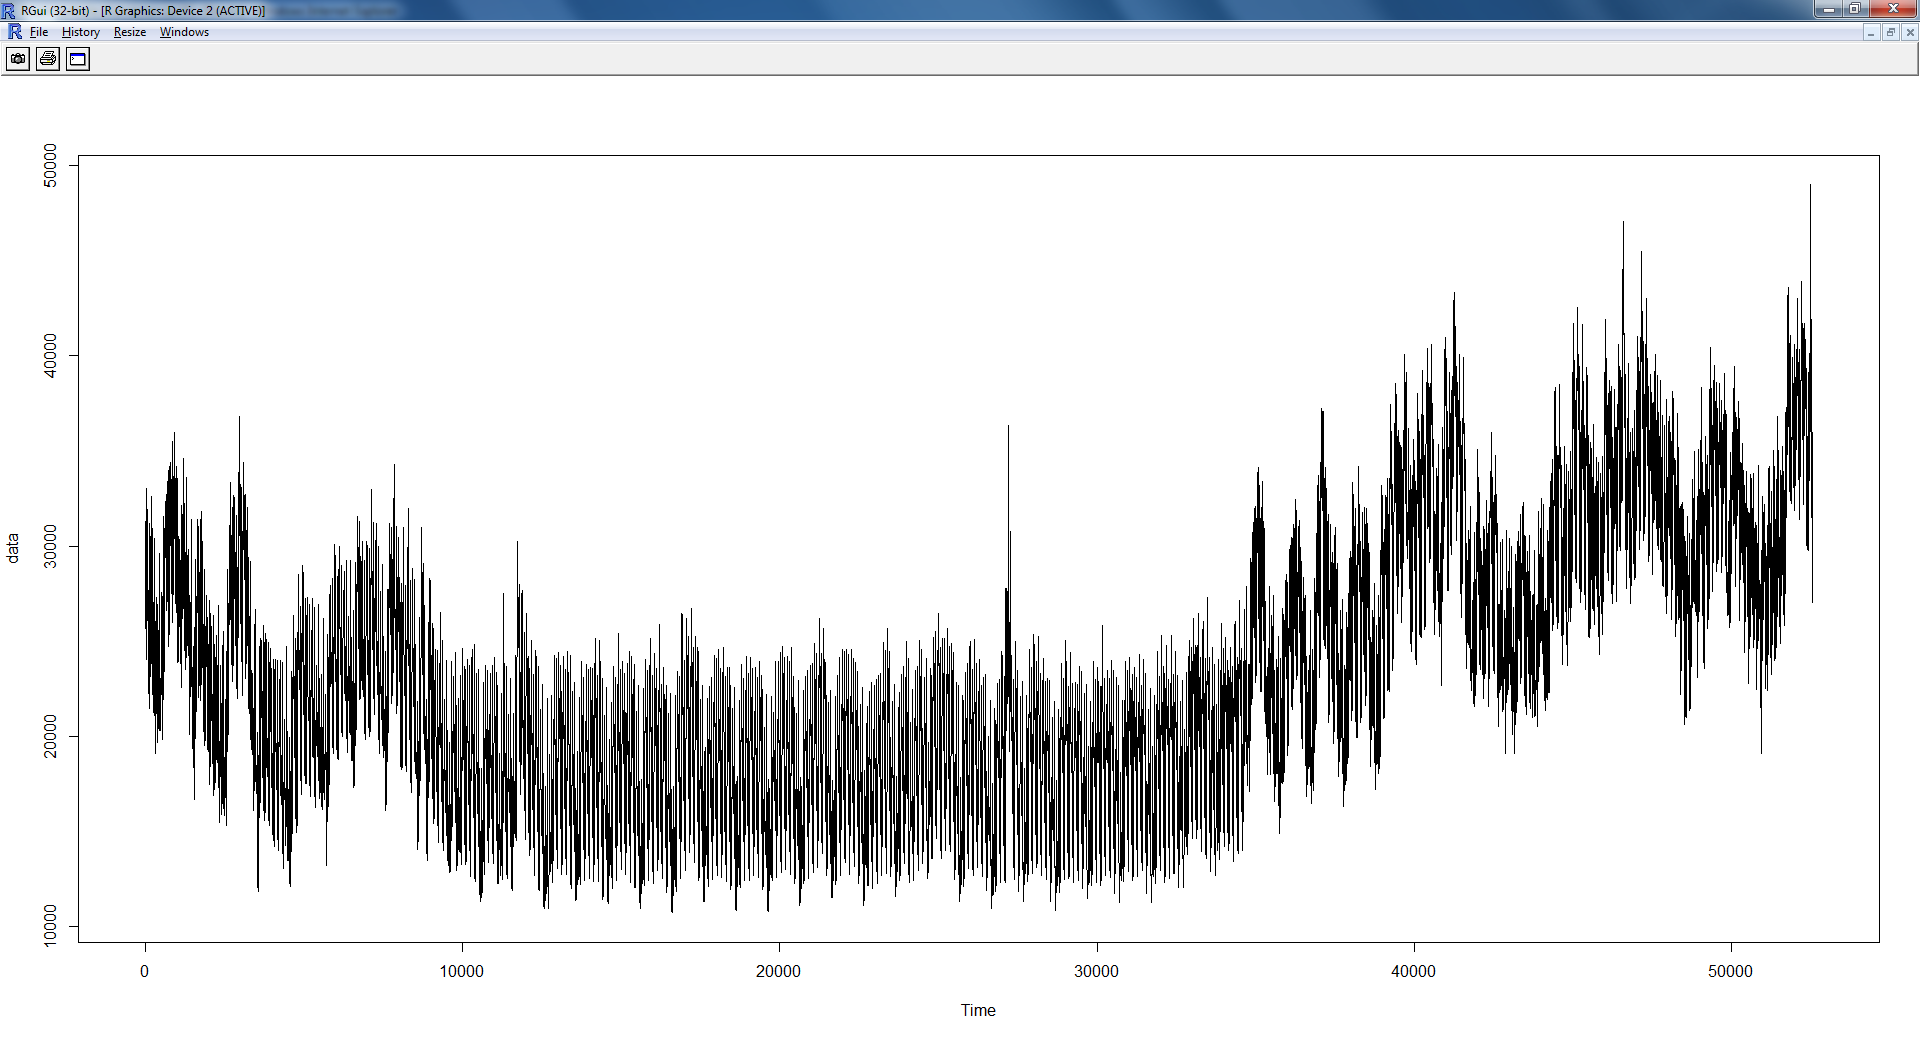
data = scan("auch.txt", skip=1)
plot.ts(data)

data.ts = ts(log(data)
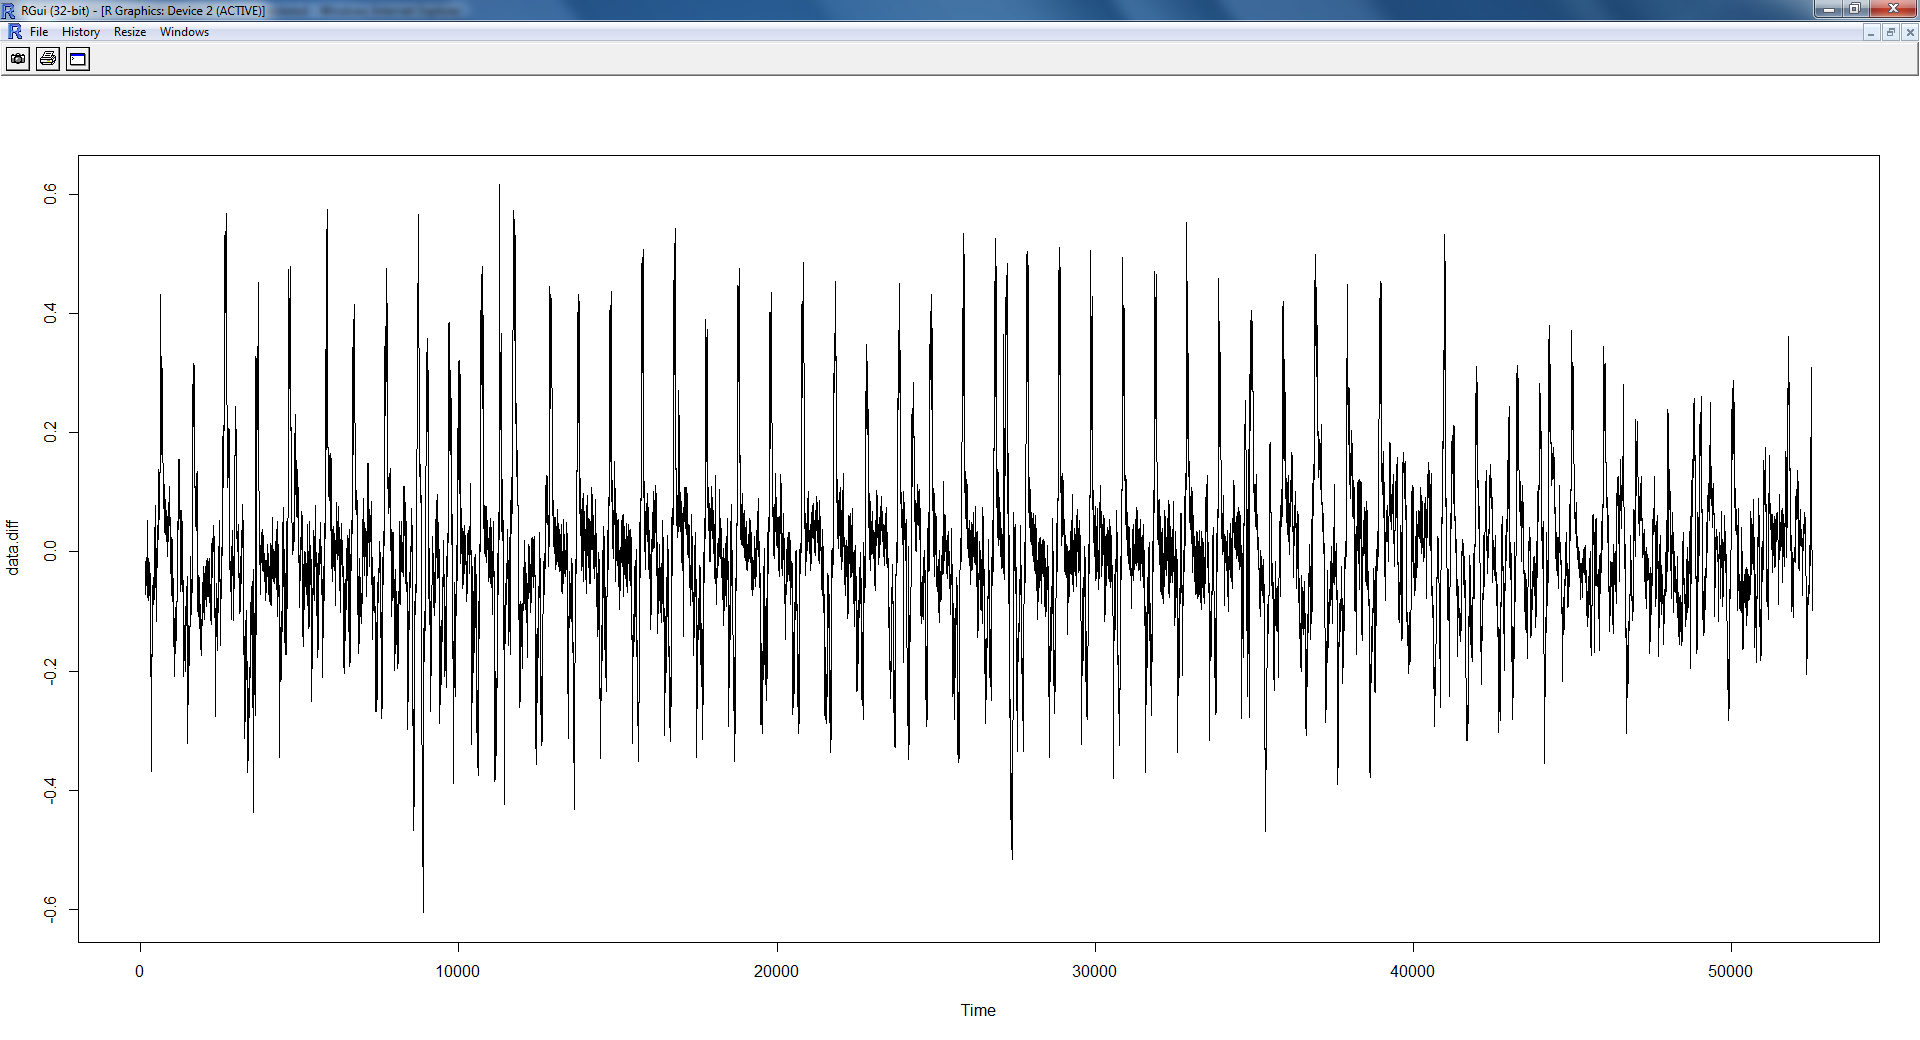
data.diff = diff(data.ts, 144)
plot.ts(data.diff)

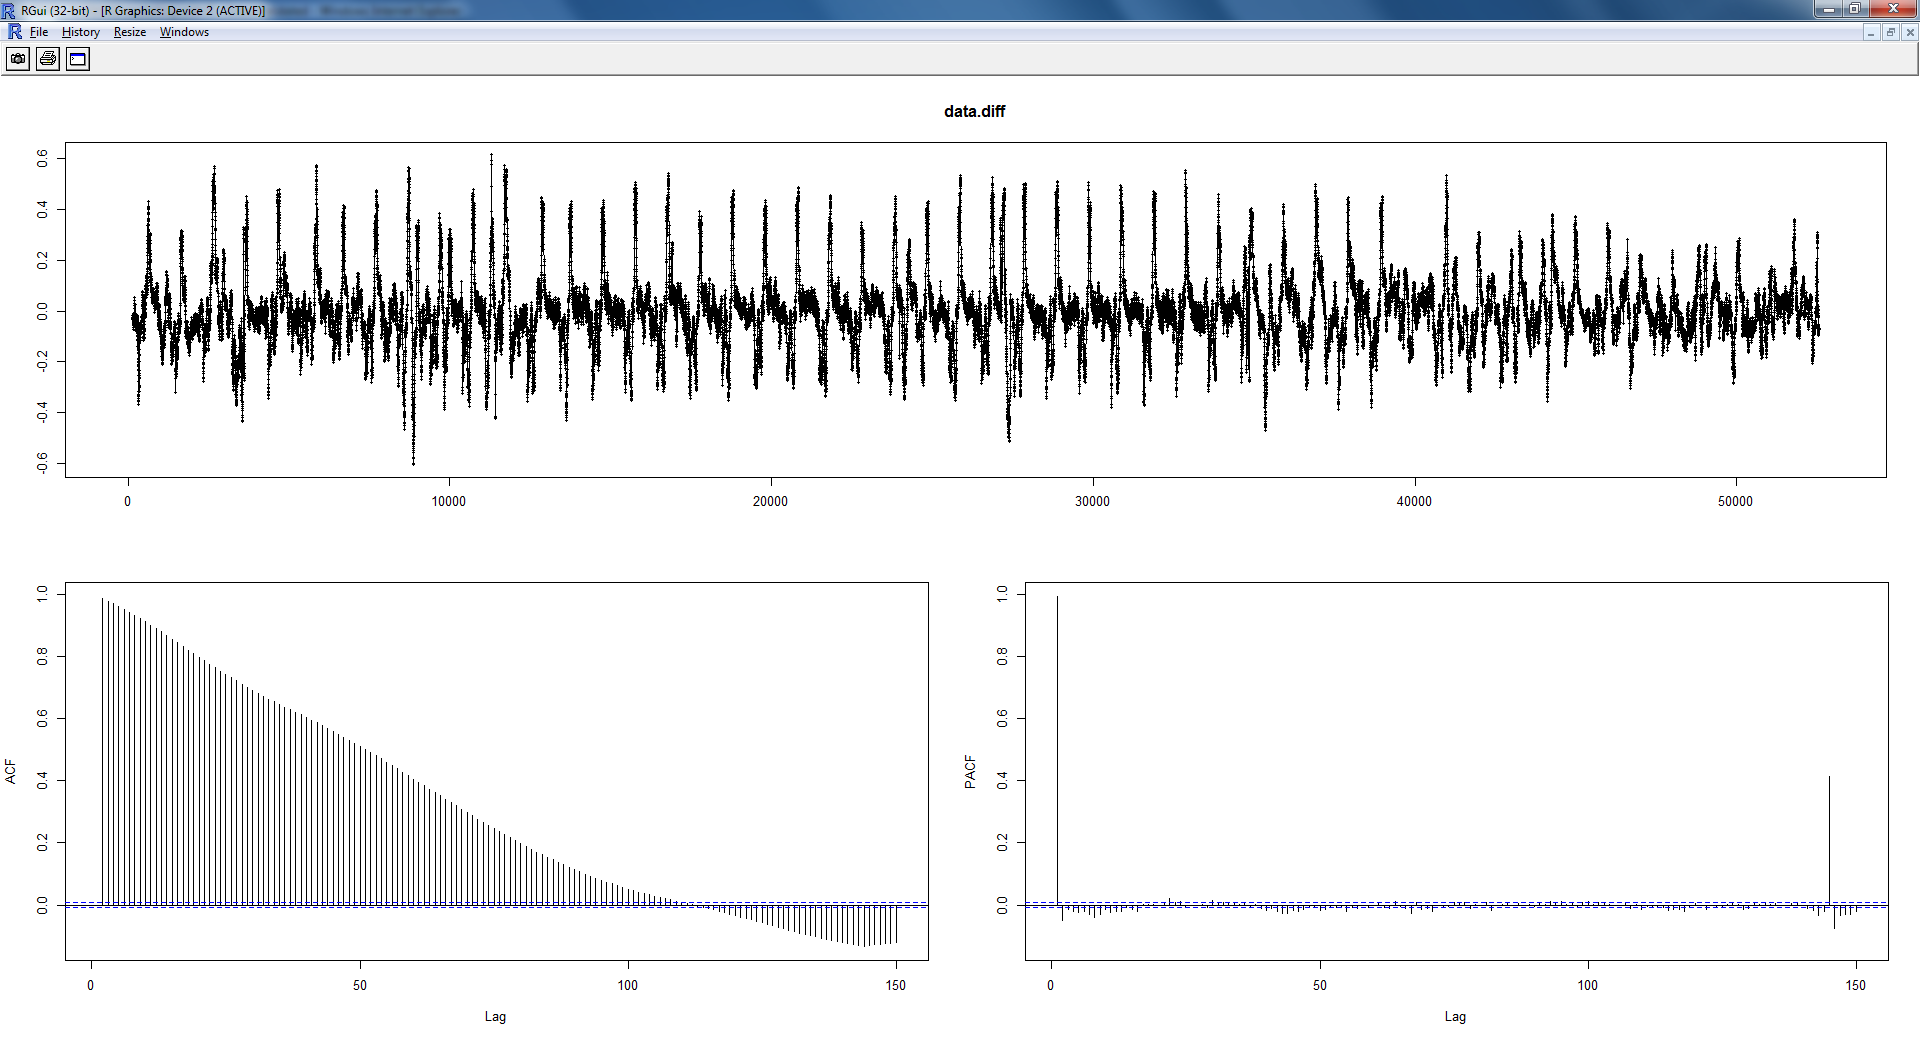
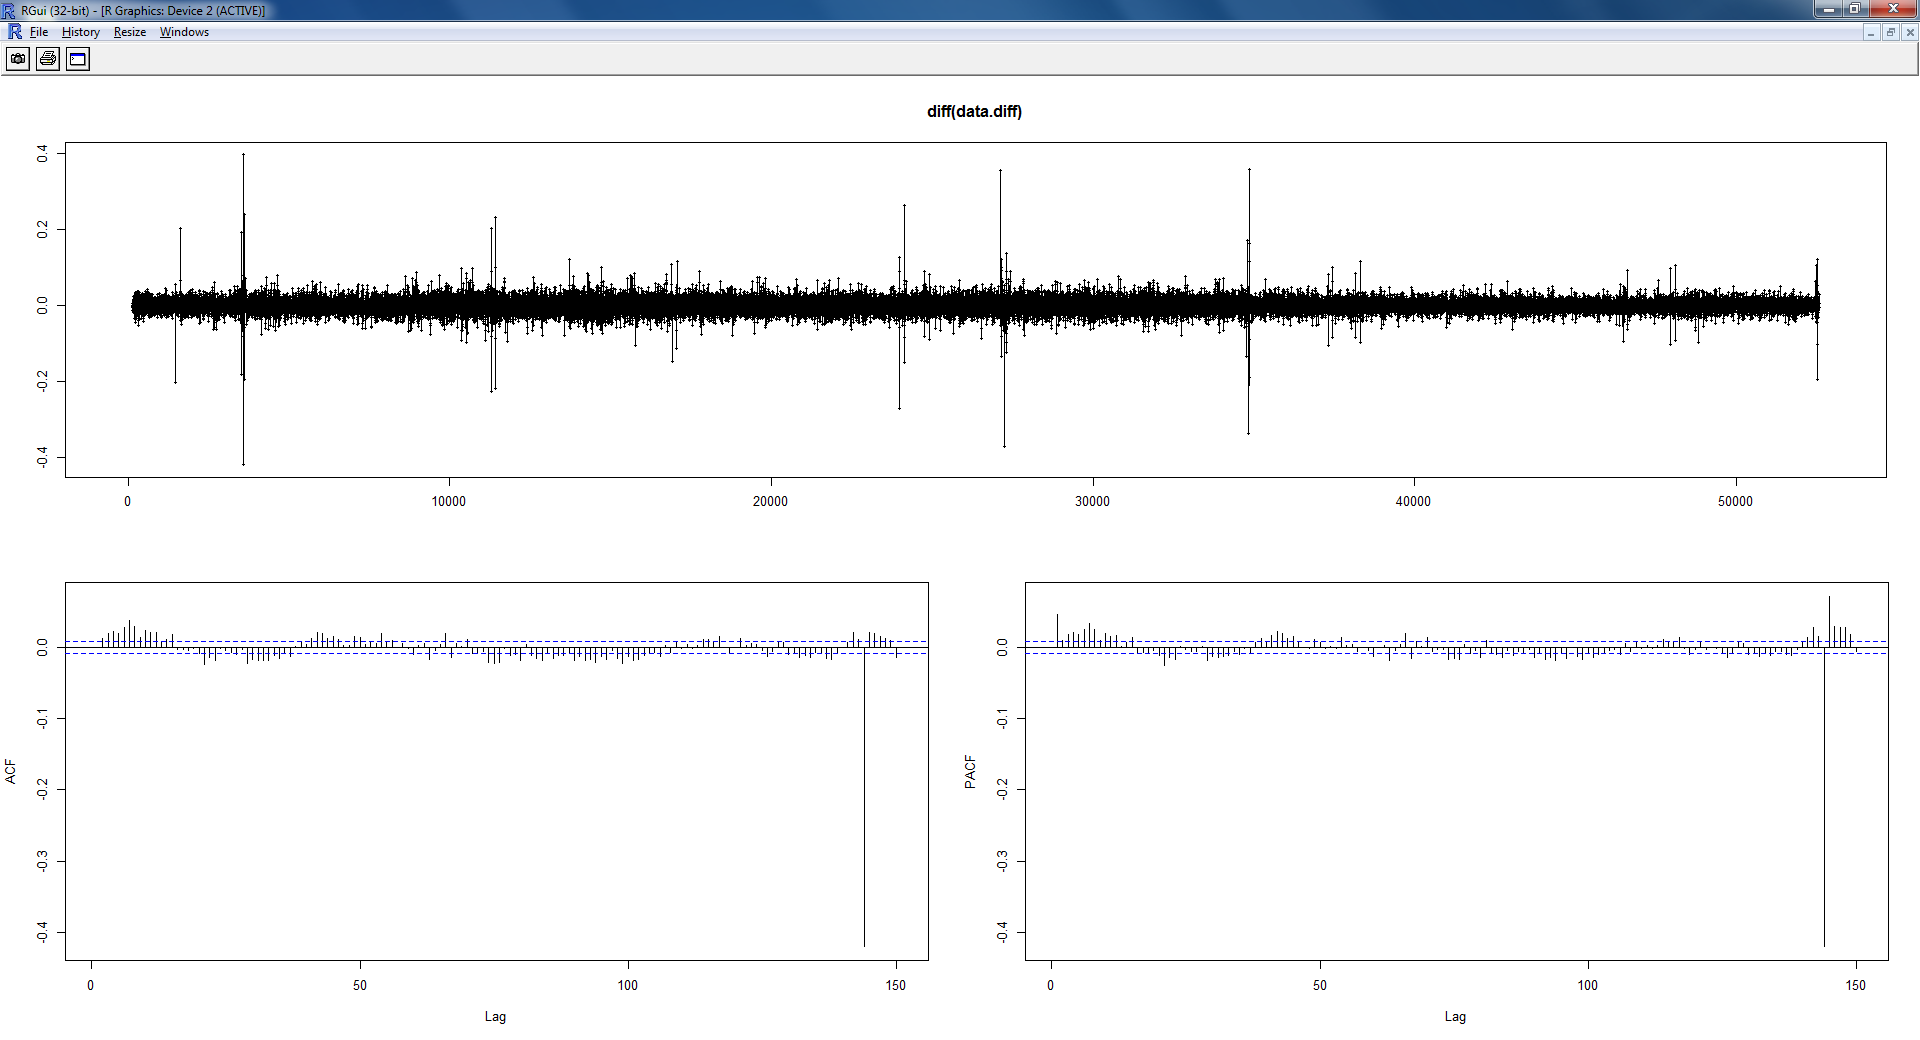
Which seems somehow stationary to me. I then proceed to look at the acf/pacf, and had to differentiate once more because it wasn't stationary in fact :
tsdisplay(data.diff, lag.max=150)
tsdisplay(diff(data.diff), lag.max=150)


And I really don't know how to handle these results, so I hoped I could find some help here, because I came across the website a lot during my researchs.
Thanks in advance, and I apologies for any grammatical mistakes or vocabulary error ; English is not my native language.
Edit : does anyone know why my pictures won't appear ?
Edit bis : nvm in fact it might be me, because imgur is blocked on my work computer
