43
$\begingroup$

Comments: Firstly I would like to say a big thank you to the author of the new tsoutliers package which implements Chen and Liu's time series outlier detection which was published in the Journal of the American Statistical Association in 1993 in Open Source software $R$.

The package detects 5 different types of outliers iteratively in time series data:

  1. Additive Outlier (AO)
  2. Innovation Outlier (IO)
  3. Level Shift (LS)
  4. Temporary change (TC)
  5. Seasonal Level Shift (SLS)

What is even more great is that this package implements auto.arima from forecast package so detecting outliers is seamless. Also the package produces nice plots for better understanding of the time series data.

Below are my questions:

I tried running few examples using this package and it worked great. Additive outliers and level shift are intuitive. However, I had 2 questions with regards to handing Temporary Change outlier and Innovational outliers which I'm unable to understand.

Temporary Change Outlier Example:

Consider the following example:

library(tsoutliers)
library(expsmooth)
library(fma)

outlier.chicken <- tsoutliers::tso(chicken,types = c("AO","LS","TC"),maxit.iloop=10)
outlier.chicken
plot(outlier.chicken)

The program rightly detects a level shift and a temporary change at the following location.

Outliers:
  type ind time coefhat tstat
1   LS  12 1935   37.14 3.153
2   TC  20 1943   36.38 3.350

Below is the plot and my questions.

  • How to write the temporary change in an equation format ? (Level shift can be easily written as a binary variable, anytime before 1935/Obs 12 is 0 and any time after 1935 and after is 1.)

The equation for temporary change in the package manual and the article is given as :

$$ L(B) = \frac{1} {1-\delta B} $$

where $\delta$ is 0.7. I'm just strugling to translate this to the example above.

  • My second question is about innovational outlier, I have never come
    across an innovational outlier in practice. any numercial example or a case example would be very helpful.

outliers

Edit: @Irishstat, the tsoutliers function does an excellent job in identifying outliers and suggesting an appropriate ARIMA model. Looking at the Nile dataset, see below application of auto.arima and then applying tsoutliers (with defaults which includes auto.arima):

auto.arima(Nile)
Series: Nile 
ARIMA(1,1,1)                    

Coefficients:
         ar1      ma1
      0.2544  -0.8741
s.e.  0.1194   0.0605

sigma^2 estimated as 19769:  log likelihood=-630.63
AIC=1267.25   AICc=1267.51   BIC=1275.04

After applying tsoutliers function, it identifies an LS outlier and additive outlier and recommends an ARIMA order (0,0,0).

nile.outliers <- tso(Nile,types = c("AO","LS","TC"))
nile.outliers
Series: Nile 
ARIMA(0,0,0) with non-zero mean 

Coefficients:
      intercept       LS29       AO43
      1097.7500  -242.2289  -399.5211
s.e.    22.6783    26.7793   120.8446

sigma^2 estimated as 14401:  log likelihood=-620.65
AIC=1249.29   AICc=1249.71   BIC=1259.71

Outliers:
  type ind time coefhat  tstat
1   LS  29 1899  -242.2 -9.045
2   AO  43 1913  -399.5 -3.306

enter image description here

$\endgroup$
14
  • 8
    $\begingroup$ I am glad to see that you found the package useful, thanks! BTW I have fixed a typo in the function that plots the results so that in the next release of the package the y-axis will cover the range of both the original and the adjusted series. $\endgroup$
    – javlacalle
    Commented Jun 26, 2014 at 22:55
  • 2
    $\begingroup$ In the last version of the package, the function tsoutliers has been renamed as tso to avoid conflict with a function of the same name in package forecast. $\endgroup$
    – javlacalle
    Commented Jun 28, 2014 at 8:51
  • 1
    $\begingroup$ @javlacalle I downloaded the latest tsoutliers package it still has tsoutliers not tso. I'm not sure when the package will be updated. I'm glad that we have different funtion names. $\endgroup$
    – forecaster
    Commented Jun 30, 2014 at 13:55
  • $\begingroup$ I rushed a little bit informing about the update. It takes some time until it is updated on CRAN. I've just seen that the latest version 0.4 can be downloaded from CRAN. $\endgroup$
    – javlacalle
    Commented Jun 30, 2014 at 17:34
  • $\begingroup$ @javlacalle I found tsoutliers really difficult to install on my mac. I brew installed gsl, I tried to compile using clang and gcc and neither works. I think it is an awesome package but the installation really broke my heart. $\endgroup$
    – B.Mr.W.
    Commented Nov 24, 2014 at 21:47

1 Answer 1

23
$\begingroup$

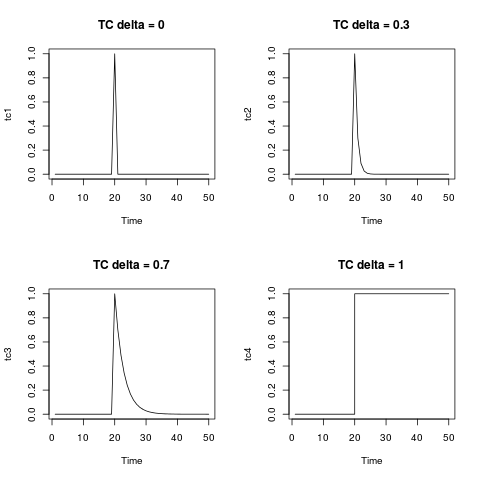
The temporary change, TC, is a general type of outlier. The equation given in the documentation of the package and that you wrote is the equation that describes the dynamics of this type of outlier. You can generate it by means of the function filter as shown below. It is illuminating to display it for several values of delta. For $\delta=0$ the TC collapses in an additive outlier; on the other extreme, $\delta=1$, the TC is like a level shift.

tc <- rep(0, 50)
tc[20] <- 1
tc1 <- filter(tc, filter = 0, method = "recursive")
tc2 <- filter(tc, filter = 0.3, method = "recursive")
tc3 <- filter(tc, filter = 0.7, method = "recursive")
tc4 <- filter(tc, filter = 1, method = "recursive")
par(mfrow = c(2,2))
plot(tc1, main = "TC delta = 0")
plot(tc2, main = "TC delta = 0.3")
plot(tc3, main = "TC delta = 0.7")
plot(tc4, main = "TC delta = 1", type = "s")

tremporary change

In your example, you can use the function outliers.effects to represent the effects of the detected outliers on the observed series:

# unit impulse
m1 <- ts(outliers.effects(outlier.chicken$outliers, n = length(chicken), weights = FALSE))
tsp(m1) <- tsp(chicken)
# weighted by the estimated coefficients
m2 <- ts(outliers.effects(outlier.chicken$outliers, n = length(chicken), weights = TRUE))
tsp(m2) <- tsp(chicken)

The innovational outlier, IO, is more peculiar. Contrary to the other types of outliers considered in tsoutliers, the effect of the IO depends on the selected model and on the parameter estimates. This fact can be troublesome in series with many outliers. In the first iterations of the algorithm (where the effect of some of the outliers may not have been detected and adjusted) the quality of the estimates of the ARIMA model may not be good enough as to accurately define the IO. Moreover, as the algorithm makes progress a new ARIMA model may be selected. Thus, it is possible to detect an IO at a preliminary stage with an ARIMA model but eventually its dynamic is defined by another ARIMA model chosen in the last stage.

In this document (1) it is shown that, in some circumstances, the influence of an IO may increase as the date of its occurrence becomes more distant into the past, which is something hard to interpret or assume.

The IO has an interesting potential since it may capture seasonal outliers. The other types of outliers considered in tsoutlierscannot capture seasonal patterns. Nevertheless, in some cases it may be better to search for a possible seasonal level shifts, SLS, instead of IO (as shown in the document mentioned before).

The IO has an appealing interpretation. It is sometimes understood as an additive outlier that affects the disturbance term and then propagates in the series according to the dynamic of the ARIMA model. In this sense, the IO is like an additive outlier, both of them affect a single observation but the IO is an impulse in the disturbance term while the AO is an impulse added directly to the values generated by the ARIMA model or the data generating process. Whether outliers affect the innovations or are outside the disturbance term may be a matter of discussion.

In the previous reference you may find some examples of real data where IO are detected.


(1) Seasonal outliers in time series. Regina Kaiser and Agustín Maravall. Document 20.II.2001.

$\endgroup$
20
  • 1
    $\begingroup$ The main advantage of using forecast::auto.arima along with tsoutliers is that everything gets automated. However, it is advisable to run the automatic procedures with alternative options. You may first for example look at the ACF or unit root tests and then choose an ARIMA model to be passed to tsoutliers. If any outliers are found for your proposed model then you can repeat again the analysis for the adjusted series. It is an iterative process. The automatic procedure provides a helpful guide but it may not necessarily give the ultimate or unique solution. $\endgroup$
    – javlacalle
    Commented Jun 26, 2014 at 23:54
  • 1
    $\begingroup$ The procedure to locate outliers is iterative. For safety a limit is set on the number of allowable iterations. When you observe the warning you may try running the algorithm increasing the argument maxit.iloop to 5-6 and see if the results change. If the warning is returned with a large maxit.iloop (e.g. 20 or more) it may be a sign that something is not being modelled properly. Removing IO from the types of outliers to be considered may be a good option in some cases. In most cases you can ignore the warning. You can use suppressWarnings to avoid them. $\endgroup$
    – javlacalle
    Commented Jun 27, 2014 at 0:08
  • 2
    $\begingroup$ @mugen I don't know a textbook covering this issue thoroughly. As the approach discussed in this post is related to intervention analysis, any textbook (on Econometrics or Time Series) with a chapter about this issue would be helpful; for example, Time Series Analysis. With Applications in R. For details, you should review some of the many journal articles dealing with this issue, starting for example by Chen and Liu (1993) and the references therein. $\endgroup$
    – javlacalle
    Commented Jan 20, 2015 at 13:29
  • 2
    $\begingroup$ @mugen, I would also check out Tsay's article. In addition, I would check classic book by Pankratz which has good coverage on outliers. $\endgroup$
    – forecaster
    Commented Jan 24, 2015 at 0:31
  • 1
    $\begingroup$ @Frank I have fixed the link and added the reference. $\endgroup$
    – javlacalle
    Commented Mar 10, 2020 at 21:53

Your Answer

By clicking “Post Your Answer”, you agree to our terms of service and acknowledge you have read our privacy policy.

Not the answer you're looking for? Browse other questions tagged or ask your own question.