1
$\begingroup$

Consider the below time series. I have marked a typical outlier (that needs to be removed) and a typical level shift (which is genuine data, not an outlier). time series - normal
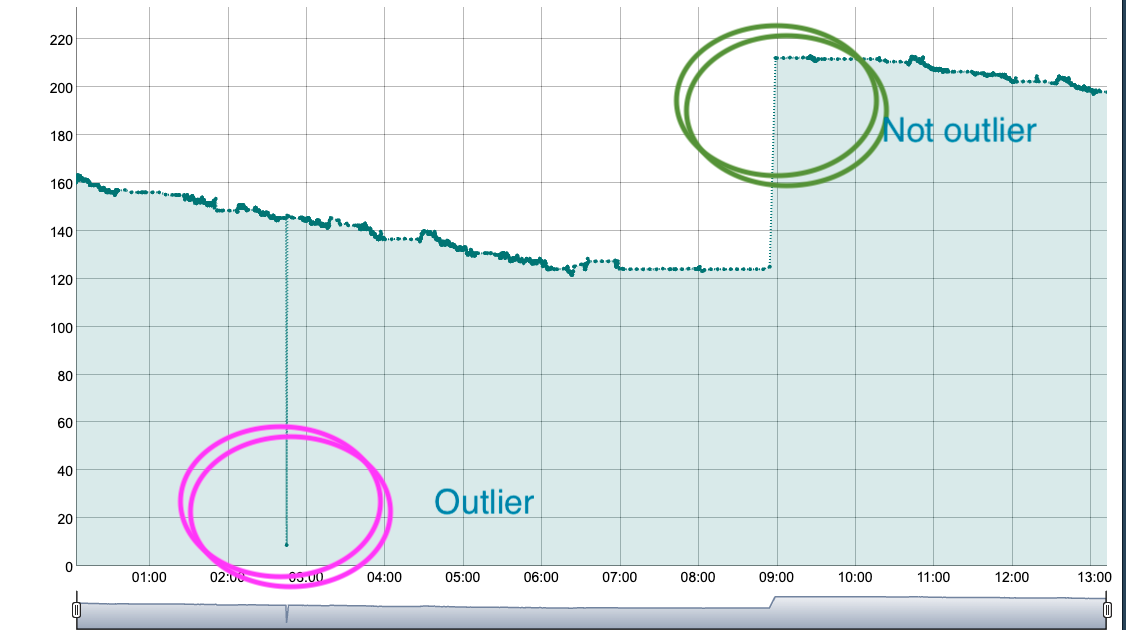
The above time series is easy to handle by simple "differencing" and dropping any two consecutive values if their sum is much smaller (say 1/10th) of the individual values before differencing.

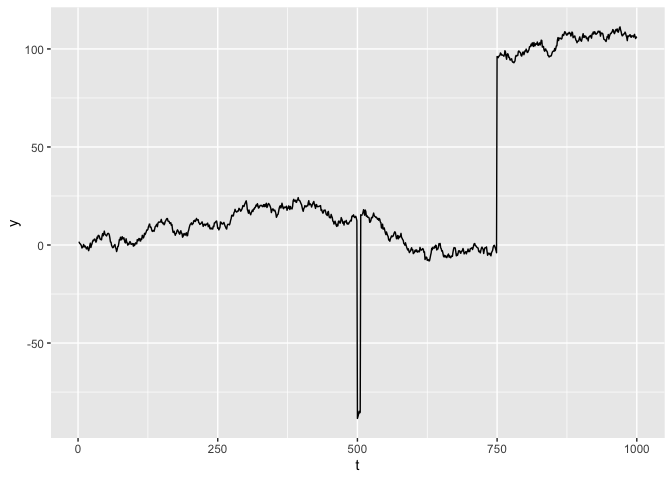
The problem starts when the spike stays on for a few samples, like a deep-pit - as shown in below time series chart. time series anamolous
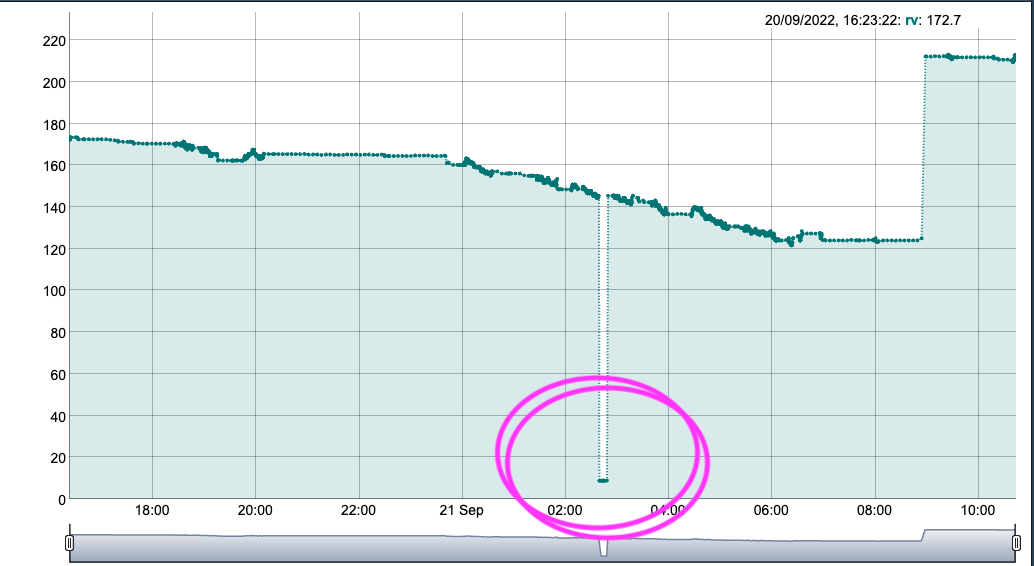
The naked eye can see the dip as an outlier, but writing an algorithm gets increasingly complex as it needs sliding window means, standard deviations, etc. And the sliding window algo invariably fails in specific cases when the window size is smaller than the width of the deep-pit, or when there is a permanent change of level.

Can someone suggest a statistical algorithm to get rid of such spikes? [These are actually sensor errors due to a known problem (the battery voltage gets disconnected).]

Update After Eoin's solution, which is close to working the following situation still fails.

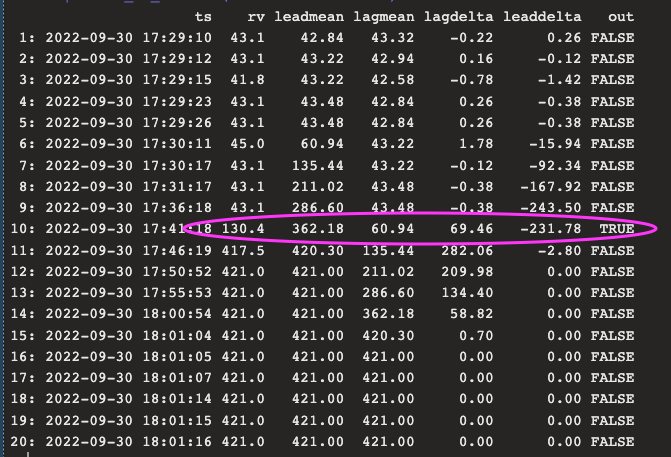
All data points on the line between the sudden level shift are also classified as outliers.

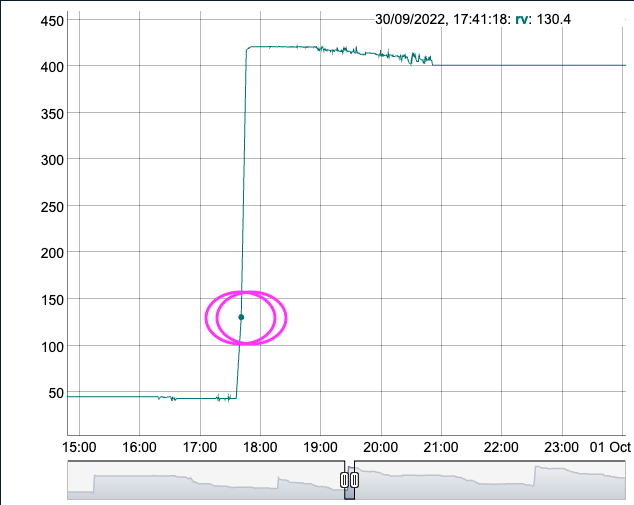
See the two charts below, and it is self-evident that the marked point is not an outlier.

Midpoint enter image description here

$\endgroup$
1
  • $\begingroup$ It appears that your outliers are exclusively very small values (around 10) while non-outliers are significantly higher than this. I would suggest just replacing all outlier values by the last observed 'valid' value and then detecting changepoints on this new series. $\endgroup$ Commented Oct 21, 2022 at 14:38

1 Answer 1

1
$\begingroup$

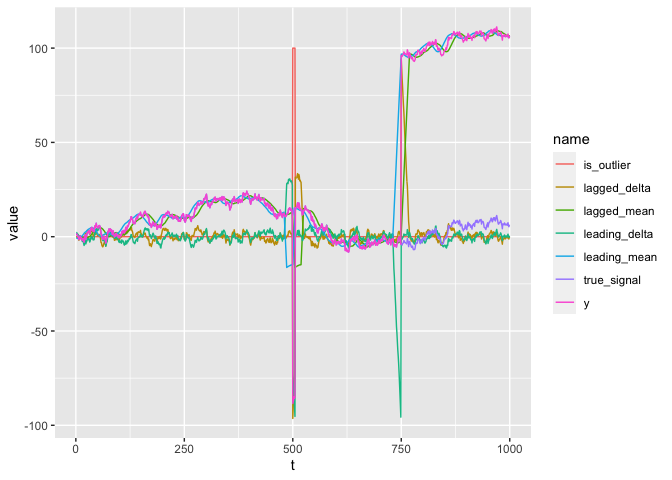
A useful property here is that the outlier observations are different from both the mean of window of 20 or so points that come before them, and different from the window of points that come after. The level shift will be different from the window before, or different from the window after, but not different from both simultaneously. This means you can use a rule along the lines of

(abs(x - previous_window) > threshold) & (abs(x - next_window) > threshold)

Of course, you will still need to tweak the window widths and thresholds...

Code example

library(tidyverse)
n = 1000
times = seq(1, n)
true_signal = cumsum(rnorm(n)) # Random walk
yhat = ifelse(times < 750, true_signal, true_signal + 100) # Add jumps
y = rnorm(n, yhat, .1) # Add noise
y[500:505] = y[500:505] - 100
df = data.frame(t = times, true_signal, y)

ggplot(df, aes(t, y)) + geom_path()


# Detect true outliers
window = 20
threshold = 20

df$lagged_mean = map_dbl(times, function(t){
  mask = (df$t > t - window) & (df$t <= t)
  mean(df$y[mask])
})

df$leading_mean = map_dbl(times, function(t){
  mask = (df$t >= t) & (df$t < t + window)
  mean(df$y[mask])
})

df = mutate(df,
            lagged_delta = y - lagged_mean,
            leading_delta = y - leading_mean,
            is_outlier = abs(lagged_delta) > threshold & abs(leading_delta) > threshold)

df %>%
  mutate(is_outlier = is_outlier * 100) %>% # For visibility
  pivot_longer(-t) %>%
  ggplot(aes(t, value, color = name)) +
  geom_path()

Created on 2022-10-18 by the reprex package (v2.0.1)

$\endgroup$
5
  • $\begingroup$ Fantastic idea. However curious why you won't use data.table::frollmean or zoo::rollmean and instead write an elaborate map function. $\endgroup$
    – Sanjay
    Commented Oct 18, 2022 at 18:31
  • $\begingroup$ Rewriting your code in a crisper way, dt <- as.data.table(df); dt[,lagmean:=frollmean(y,n = 20,align = "left")]; dt[,leadmean:=frollmean(y,n = 20,align = "right")]; dt[,lagdelta:= y - lagmean]; dt[,leaddelta:= y - leadmean]; dt[,out:=abs(lagdelta) > 20 & abs(leaddelta) > 20] We get the same output. If you donot find any difference please let's change it to this one, so others referring may find it easier to understand. BTW your algo seems to be doing the trick. I will test on new data and drop more feedback. $\endgroup$
    – Sanjay
    Commented Oct 18, 2022 at 18:43
  • $\begingroup$ I deliberately used plain(er) syntax so that the solution can be more easily understood by people not familiar with tools for rolling functions, even if it's less efficient. $\endgroup$
    – Eoin
    Commented Oct 18, 2022 at 22:24
  • $\begingroup$ Eoin your algo fails in a mid point situation (when the level shift is happening the points on the level shift line - between the two levels) which are also detected as outliers but they are genuine data. I have tried to load the problem as part of the question, by uploading a few more charts. What could be an elegant solution to avoid this problem? $\endgroup$
    – Sanjay
    Commented Oct 19, 2022 at 17:20
  • $\begingroup$ Seems the following additional line may solve the problem and remove the mid points as outliers: dt[,out:=ifelse(y > shift(y) & y < shift(y,type = "lead") & out==T, F,out)] $\endgroup$
    – Sanjay
    Commented Oct 19, 2022 at 17:28

Your Answer

By clicking “Post Your Answer”, you agree to our terms of service and acknowledge you have read our privacy policy.

Not the answer you're looking for? Browse other questions tagged or ask your own question.