3
$\begingroup$

I'm measuring distances of various samples from a reference point. The distance is defined as a non-negative number, where $d=0$ means that the test case is identical to the reference.

My general question is: Given a set of "typical" distances, what is the proper way to tell whether a given $d_1$ "too large", compared to the "typical"?

In my particular case the distance distribution is shown on the following graph
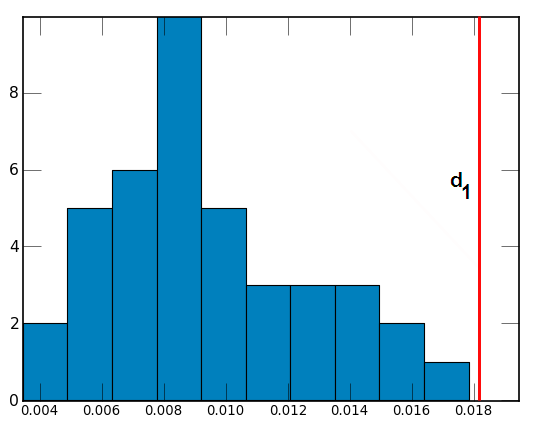
enter image description here

I failed to transform these data to anything symmetrical, so I can't use normal approximation. Any suggestions?

$\endgroup$

2 Answers 2

2
$\begingroup$

My first instinct is to say that it would be silly to make such a determination absent any knowledge of the topic. "Too large" for what, or for whom? But perhaps what you're looking for is really a test for outliers in the distribution--not that you're likely to find any in the one you've shown. Check out Dixon's Test for Outliers (sometimes called the Q-Test). I'm not thrilled with what Wikipedia provides, so you might want to check around further than that. Sorry I don't have a good web reference; I use the guidelines in the book 100 Statistical Tests by Gopal Kanji.

$\endgroup$
2
  • $\begingroup$ From what I read (e.g. chem.uoa.gr/applets/AppletQtest/Appl_Qtest2.html), Q-Test assumes normal distribution of the data. In my case this assumption is most probably wrong (see the asymmetric shape of the histogram). $\endgroup$ Commented May 15, 2011 at 8:04
  • $\begingroup$ @bgbg - You're right, for p-values to be exactly correct, you need a normal distribution. With your case and its "outliers," the distribution is slightly-to-moderately skewed. I think you could make a convincing argument that if p is nowhere near your alpha and is, say, .5, then it would not fall below your alpha under a normal distribution either. I was trying to hint earlier that you really don't need to run a test, since the lack of outliers is so apparent. $\endgroup$
    – rolando2
    Commented May 15, 2011 at 19:39
1
$\begingroup$

Can you not use the empirical distribution's 95% (or whichever you prefer) confidence limit? If your sample size is big enough, this ought to be a reasonable approximation.

$\endgroup$
2
  • $\begingroup$ I thought about such an approach, but this would mean that we assume a-priory that 5% of the existing observations are "atypical", "faulty" etc. Which might not be the case $\endgroup$ Commented May 15, 2011 at 7:57
  • 1
    $\begingroup$ Well, if you're not willing to make other assumptions (like normality), it's all you really have... How else would you define "atypical"? $\endgroup$
    – Nick Sabbe
    Commented May 15, 2011 at 15:36

Your Answer

By clicking “Post Your Answer”, you agree to our terms of service and acknowledge you have read our privacy policy.

Not the answer you're looking for? Browse other questions tagged or ask your own question.