I have a bimodal distribution, and I wish to estimate the mean and standard deviation of the population (well, these could be 2 sub-populations according to the shape).
With the mean I have no problem, the sample is relatively large (n~70), and so the sample mean is approximately normally distributed according to the central limit theorem. I can calculate the corresponding 95% CI.
Now I want to do the same for the standard deviation, but I am not sure if the same theory apply. Can I say that the variance is approximately chi squared distributed when the sample is large ?
Edit:
To test my question, I ran this simulation in R:
mu1 <- 23
mu2 <- 40
sig1 <- 4.3
sig2 <- 2.8
cpct <- 0.32
m <- 10000
means <-rep(0,m)
sds <-rep(0,m)
vars <-rep(0,m)

bimodalDistFunc <- function (n,cpct, mu1, mu2, sig1, sig2) {
  y0 <- rnorm(n,mean=mu1, sd = sig1)
  y1 <- rnorm(n,mean=mu2, sd = sig2)

  flag <- rbinom(n,size=1,prob=cpct)
  y <- y0*(1 - flag) + y1*flag
}


for (i in 1:m)
{
    bimodalData <- bimodalDistFunc(n=10000,cpct,mu1,mu2, sig1,sig2)
    means[i] = mean(bimodalData)
    sds[i] = sqrt(var(bimodalData))
    vars[i] = var(bimodalData)
}

par(mfrow=c(2,2))
hist(bimodalData)
hist(means)
hist(sds)
hist(vars)
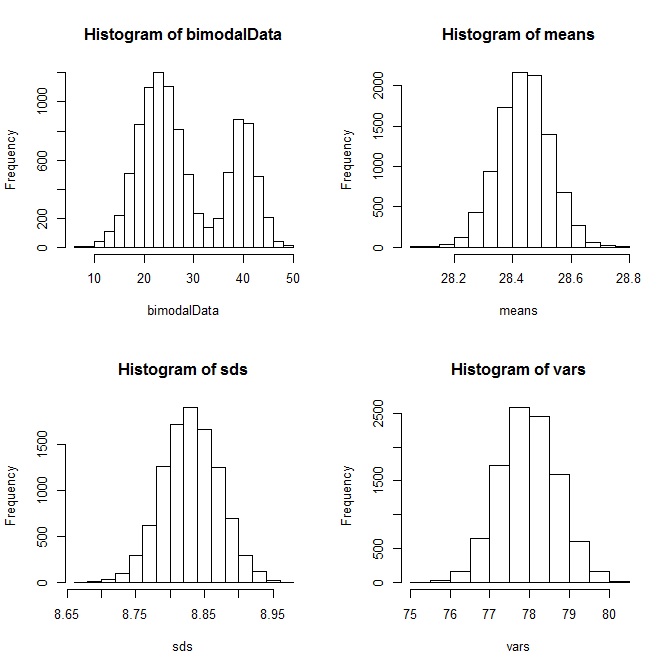
And I got the following result:

The distribution of the variances is not chi squared, but why is it normal ? (the bimodal histogram is an example of one of the simulated distributions)

