3
$\begingroup$

I have a bunch of genetic read counts for different several genes. Each gene is divided into two groups (0 and 1). What I want to do is make a vertical plot side by side of the 0 group and the 1 group. Thus if there were 10 observations in the zero group and 20 observations in the 1 Group, there would be 10 dots in the left column and 20 dots in the right column.

I would also like to iterate this over several genes.

So for instance, suppose I had a matrix as follows:

0 75
0 80
0 77
0 79
1 90
1 95
1 105
1 98
1 97

This would be 1 gene with 4 in the zero group and 5 in the 1 group. I would have several of these matrices.

Thank you!

Edit

Here's some sample data using dput:

 > dput(mydata)

list(structure(c(0, 0, 0, 1, 1, 98.4907329358843, 100.093299628285, 
101.328969073832, 99.7130588936915, 100.316498649611), .Dim = c(5L, 
2L)), structure(c(0, 0, 0, 1, 1, 1, 1, 97.0449341295192, 94.0953511135576, 
94.6964499394555, 94.9450653539671, 96.9023528925965, 94.2860553266605, 
92.3232956095601), .Dim = c(7L, 2L)), structure(c(0, 0, 0, 0, 
1, 1, 1, 1, 104.277489358474, 104.427037361567, 105.12427096276, 
104.593546894304, 105.492443088382, 105.288750134106, 105.381724838826, 
103.83948211249), .Dim = c(8L, 2L)))

What I want is a combination of the boxplot example here (where they factor by year and I would factor by column 1): http://www.ling.upenn.edu/~joseff/rstudy/summer2010_ggplot2_intro.html

with an overlay of the dots over each box plot (shown in the second solution) here: https://stackoverflow.com/questions/8387088/r-boxplot-and-stripchart-side-by-side-in-1-figure

However, for the overlay, I don't want them in the middle of each two boxplots but rather on top.

Hope that helps further explain it!

$\endgroup$
3
  • $\begingroup$ I'm not clear on the output you desire. Try looking at docs.ggplot2.org/current so you can give some visual example of what you're working towards. $\endgroup$
    – Ben
    Commented Jul 23, 2014 at 3:18
  • $\begingroup$ @Ben Gorman, I put in some more details -- thanks! $\endgroup$ Commented Jul 23, 2014 at 4:29
  • $\begingroup$ The first link uses ggplot2. Are you asking for ggplot2 displays, or was that just an example? $\endgroup$
    – Glen_b
    Commented Jul 23, 2014 at 4:47

1 Answer 1

3
$\begingroup$

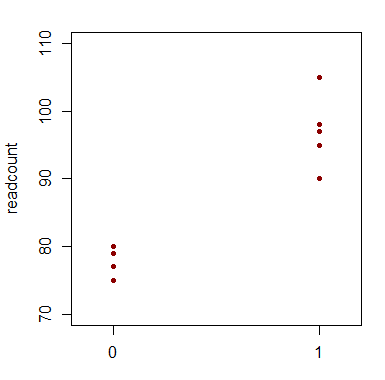
Are you after something like this?

enter image description here

If your data was in say mydata (either as a matrix or as a data frame) with columns named group and readcount, then

stripchart(readcount~factor(group),data=mydata,
            pch=20,col="darkred",vertical=TRUE,xlim=c(0.85,2.15),ylim=c(70,110))

would give that.


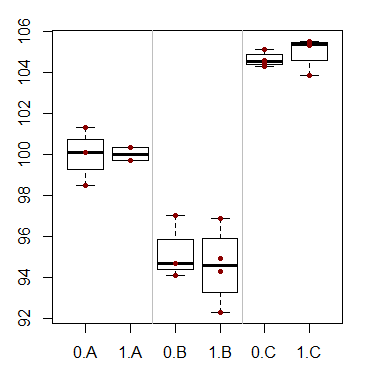
Edited to address updated question where mydata is a list of matrices:

 # add some names
 for(i in 1:3) {colnames(mydata[[i]])<-c("group","readcount")}

 #stack up data
 lengths=sapply(mydata,dim)[1,]
 mydatast=cbind(do.call("rbind", mydata),set=rep(1:3,times=lengths))

 #generate plot
 boxplot(readcount~interaction(group,LETTERS[set]),data=mydatast)
 stripchart(readcount~interaction(group,set),mydatast,add=TRUE,
            vertical=TRUE,pch=20,col="darkred")
 abline(v=c(2.5,4.5),col=8)

enter image description here

(Of course, one could add box colours for the different sets or for the 0/1 variable, and so on, as needed.)

$\endgroup$
4
  • $\begingroup$ yes, that's almost it, I have added some more details on top. Thank you for your help! $\endgroup$ Commented Jul 23, 2014 at 4:29
  • $\begingroup$ You're right of course -- the idea of a box plot only came to me after looking at it. I'll mark this question as solved and give you credit and if need be, reopen a new post. $\endgroup$ Commented Jul 23, 2014 at 4:49
  • $\begingroup$ It's worth a new post because it's now a somewhat different question (about scale -- your input here really helped though!). Take a look here, it's now much better posed: stackoverflow.com/questions/24902226/… $\endgroup$ Commented Jul 23, 2014 at 5:02
  • $\begingroup$ You're right, that question was better asked as a new question. Nevertheless, I've adding some basic info here that relates to what you ended up asking above (implemented in basic R). $\endgroup$
    – Glen_b
    Commented Jul 23, 2014 at 5:43

Your Answer

By clicking “Post Your Answer”, you agree to our terms of service and acknowledge you have read our privacy policy.

Not the answer you're looking for? Browse other questions tagged or ask your own question.