5
$\begingroup$

I am investigating the following problem: I have a large set of values, many of which are repeated. Measuring the number of distinct (or unique) values shows that their number grows much slower than the number of total values, so that with 2M values I get just ~260k distinct values, with 20M values it goes up to just ~750k distinct, and after processing 40M values there are just under a million distinct values.
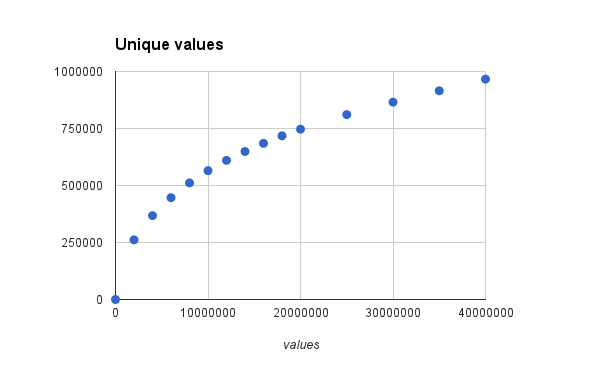
Graph of distinct values vs values

The values are real-world data points created by joining together a number of variables, each of which may take a (potentially large but finite) set of values. These variables are not necessarily independent; on the contrary, they are most likely dependent on each other.

Intuitively the values must follow some kind of power law distribution, but I cannot fit the values to a satisfying formula. I can tell you it is not an exponential curve because it isn't straight on a log-log plot; it does not appear to be logarithmic either.

The questions that I would like to answer are:

  • How many distinct values should I see after processing a given number of values?
  • What is the distribution f(x) of distinct values? So that f(1) = 1 (since the first value is certainly distinct) and f(2e6) ~ 261620.
  • What are the parameters of the distribution? So I can measure them after changing (or adding or removing) some of the independent variables and see how it affects the number of distinct values.
  • Related to the above, how does each variable contribute to the number of distinct values? I can experiment numerically, but I would like to be able to characterize the results using numerical parameters. This would tell me how dependent variables are.
  • For bonus points: how can I find out how many bits of information each variable carries? This will be related to how dependent it is.

I have not found on the Wikipedia any info about distinct values; in the literature there are some articles such as this one but they don't delve on the number of distinct values. Apparently this is called a "birthday problem". Any help is appreciated.

Note: initially asked on math.stackexchange.com, where it has been closed.

The actual numbers follow (values, distinct values):

1, 1
2000000, 261620
4000000, 367883
6000000, 446604
8000000, 511565
10000000, 565090
12000000, 610213
14000000, 649240
16000000, 684861
18000000, 717790
20000000, 746938
25000000, 810937
30000000, 865702
35000000, 915417
40000000, 966590
$\endgroup$
4
  • 2
    $\begingroup$ It may be that there's not a single simple function that describes the whole range of values. However if $u$ is the number of unique values and $n$ is the total number of values, the relationship between $\ln{u}$ and $\sqrt{\ln{n}}$ is not so far from linear. You might consider a natural spline in that scale for values of $n$ between $2\times 10^6$ and $4\times 10^7$. However, there's no particular reason I'd expect that a fit up in that area should be at all reasonable down near 1. You probably won't get good predictions where you don't have data. $\endgroup$
    – Glen_b
    Commented Aug 3, 2014 at 22:52
  • $\begingroup$ Visually it looks like a straight line; however it is not a perfect fit. There is no data near 1, but it is trivial to generate it: just start over and load a few lines, and count unique values. I did and the fit is again not good enough, although both curves look very similar. Interesting! $\endgroup$ Commented Aug 4, 2014 at 0:21
  • $\begingroup$ I understand, I just supplied the missing data near 1 and surprisingly the relationship held, even better than for the rest. It is interesting that the your approximation fits well visually, but numerically it is not good enough for predictions. I just wonder if the near fit is due to some fundamental relationship or just a result of chance. $\endgroup$ Commented Aug 4, 2014 at 7:00
  • 2
    $\begingroup$ I doubt it's really anything but chance. However, you may get some benefit from fitting that model locally (local linear regression), and tracking the way the parameters change as you move across the range of the data -- it may give clues to a better model. $\endgroup$
    – Glen_b
    Commented Aug 4, 2014 at 7:41

1 Answer 1

4
$\begingroup$

This is an interesting but difficult problem known as the generalized coupon collector problem.

In the standard coupon collector problem, coupons have one of $n$ distinct types with equal probability, and the question is to know how many coupons you need to collect in order to have all the types. In the generalized version of the problem, the types are not equiprobable.

Available results on the coupon collector problem are that the average number of coupons required to collect all the types is $O\left(n\log(n)\right)$ and that the asymptotic distribution as $n \rightarrow \infty$ is a Gumbel. Similar results on the generalized problem are also available, but they are significantly more complex (see this article for the asymptotic distribution for instance).

I do not think that there is an answer to your question in its full generality because the curve will be a function of as many parameters as there are distinct values (the parameters being their probabilities). In the case you can make the assumption that the probabilities are approximately equal, the curve of the average process can be computed as follows.

Let $S_k$ be the number of samplings you need to go from $k-1$ to $k$ distinct values, and $T_k$ be the total number of samplings to obtain $k$ distinct values. Obviously $T_k = S_1 + \ldots +S_k$. It is easy to see that $S_k$ has a geometric distribution with probability $(n-k+1)/n$, so the average is $E(S_k) = n / (n-k+1)$ and

$$E(T_k) = n \left(\frac{1}{n} + \ldots + \frac{1}{n-k+1}\right) \sim n\left(\log(n)-\log(n-k)\right).$$

With a bit of algebra, we come to the following functional form for the curve, where $n$ is the only parameter.

$$y = n \left(1 - e^{-x/n}\right).$$

Since you wrote that the curve is far from an exponential, I guess that the distinct values have different probabilities, but in this case the problem is in another league.

$\endgroup$
2
  • 2
    $\begingroup$ Thanks for your most interesting answer, it has opened a whole area of research. Some good references aren't behind annoying paywalls, like the one you provide or this delightful article. I don't have a solution for my specific case, but I have found that an exponential of the form $880 x^{0.4}$ is a suitable upper bound. $\endgroup$ Commented Aug 5, 2014 at 0:00
  • 1
    $\begingroup$ @alexfernandez I am glad that I could be of any help. In addition I would like to mention that the Coursera class (along with the associated textbook) by Robert Sedgewick is quite interesting and clear. It is this one. $\endgroup$
    – gui11aume
    Commented Aug 7, 2014 at 17:09

Your Answer

By clicking “Post Your Answer”, you agree to our terms of service and acknowledge you have read our privacy policy.

Not the answer you're looking for? Browse other questions tagged or ask your own question.