1
$\begingroup$

I am learning about K-means algorithm, and I have generated a dataset with 150000 data points, with 10000 points per cluster. (Scatter plot at the bottom)

When I run K-means on the dataset, I first randomly pick 15 data points as initial centers, and then use the traditional iterative approach to update the centers until convergence. However, this gives undesired results, a sample as follows:

Cluster 0: 14.136004, 48.625093
Cluster 1: 82.353156, 43.582929
Cluster 2: 45.823547, 61.650882
Cluster 3: 58.467780, 90.994505
Cluster 4: 79.734026, 78.028310
Cluster 5: 58.467912, 91.018907
Cluster 6: 89.781302, 26.638219
Cluster 7: 75.079899, 97.764001
Cluster 8: 63.669296, 73.583218
Cluster 9: 41.334973, 19.812627
Cluster 10: 75.589260, 97.997850
Cluster 11: 73.342196, 63.601545
Cluster 12: 81.802223, 43.727663
Cluster 13: 93.317351, 91.788683
Cluster 14: 82.203258, 44.138953

I have two questions:

  1. Note that Cluster 1, 12, and 14 correspond to the same cluster, yet the algorithm converges there. Is this normal for the outcome of K-means algorithm?

  2. Is it possible that when we re-calculate the location of a new center, the set of points we average over is empty? i.e. for all data points, they are nearer to some other center than the particular center we try to calculate?
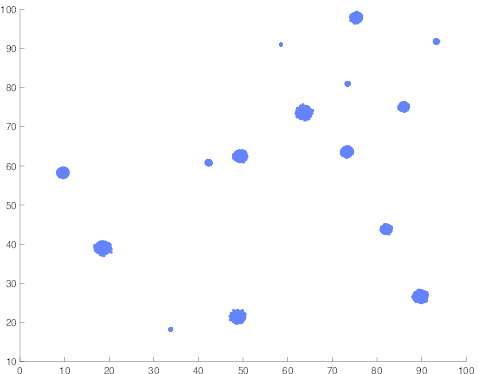
Sample Data Input

$\endgroup$
6
  • 1
    $\begingroup$ How is your image related to the question? I was not able to find Cluster_0 there. $\endgroup$ Commented Nov 27, 2014 at 0:50
  • $\begingroup$ @SalvadorDali The clusters are un-ordererd final results given by the algorithm. And yes, cluster_0 does not correspond to a real cluster in the dataset. Also, Cluster 1, 12,14 all correspond to a same cluster. That's why I asked this question... $\endgroup$
    – Zz'Rot
    Commented Nov 27, 2014 at 0:53
  • $\begingroup$ still can not understand: 1, 12, 14 are the same cluster (s they shown as one, which I can not see on the picture). But there are 15 clusters there (almost none of them corresponds to the numbers above). $\endgroup$ Commented Nov 27, 2014 at 1:00
  • $\begingroup$ There isn't a spot at (14, 48) in the plot. That's what @SalvadorDali is referring to. $\endgroup$ Commented Nov 27, 2014 at 1:02
  • $\begingroup$ @gung That's correct. My guess is that the center (14, 48) corresponds to a weighted average of the two left-most (by x-coord) clusters in the dataset. $\endgroup$
    – Zz'Rot
    Commented Nov 27, 2014 at 1:07

1 Answer 1

1
$\begingroup$
  1. Yes, perfectly normal. I don't think this can be avoided if you choose random starting points.

  2. Yes, in principle. In R, if this happens and you try to run k-means clustering, it will throw an error as in this example:

    x <- matrix(c(1,2,1.1,1.1,1,1,2,1.1,1,1.1), nc=2) kmeans(x, 4, centers=matrix(rnorm(8), nc=2)) -> out # random starting points Error: empty cluster: try a better set of initial centers

However, I don't think this can happen if you assign the cluster centres to be random points in the dataset, which is the default behaviour of the kmeans function in R.

x <- matrix(c(1,2,1.1,1.1,1,1,2,1.1,1,1.1), nc=2)
kmeans(x, 4)
$\endgroup$

Your Answer

By clicking “Post Your Answer”, you agree to our terms of service and acknowledge you have read our privacy policy.

Not the answer you're looking for? Browse other questions tagged or ask your own question.