2
$\begingroup$

When I have one confusion matrix for each cutoff level (from 0.00 to 0.99), I can compute AUC coefficient. It looks like:

Cutoff   TP    | FP     | TN     | FN
 0.99    0     | 0      | 10,000 | 5,000
                      ...
 0.80    300   | 200    | 9,800  | 4,700
                      ...
 0.00    5,000 | 10,000 | 0      | 0

It does not difficult to compute AUC coefficient from this table using this formula:

$$ AUC \approx \sum_{c=0.98}^{0.00} \Delta FPR_c \cdot TPR_c + \frac{1}{2} \cdot \Delta TPR_c \cdot \Delta FPR_c$$

Is there an elegant way to approximate confusion matrices from AUC coefficient?


EDIT

I understand that I need ROC curve shape to approximate exactly. I have number of instances per class and initial ROC curve, and I want to know is there any reason to improve the model (→ AUC) to reach a specific profit (sum of confusion matrix elements with weights). I have an idea to "inflate" the ROC curve, but it does not sounds good. Any ideas in this case?

$\endgroup$

1 Answer 1

4
$\begingroup$

You cannot map AUC to contingency tables because AUC does not contain any information about the shape of the curve (e.g. does your model work well at high precision or high recall?).

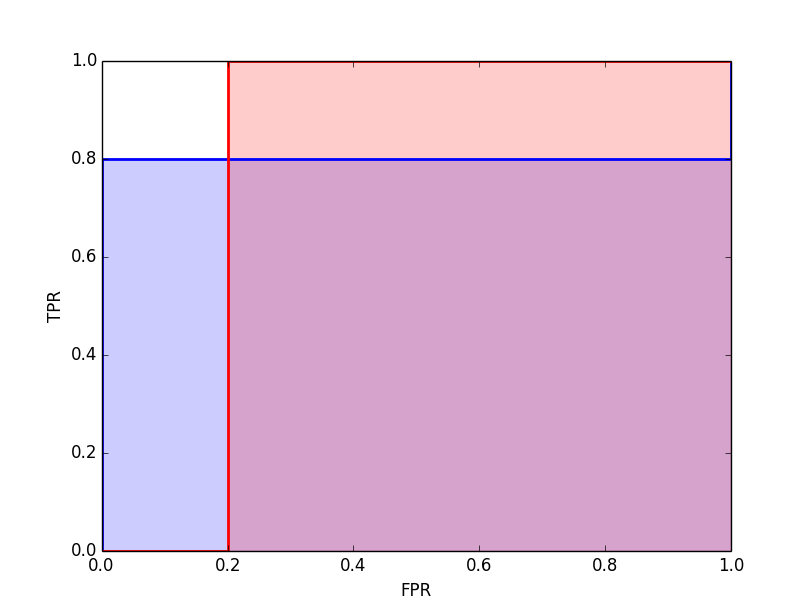
To see this, suppose you have an AUC of 80%. You could obtain this AUC in several ways, the simplest being "rectangular" ROC curves (this is contrived but still valid): (1) a model that has TPR of 0.8 at FPR up to 1 or (b) a model that has TPR of 1 at FPR of 0.2.

The following rankings both produce such "rectangular" ROC curves with AUC=80%, (values being labels):

$$1: [1, 1, 1, 1, 0, 1]$$ $$2: [0, 1, 0, 0, 0, 0]$$

The resulting curves (1 in blue, 2 in red): enter image description here

You can derive contingency tables from an ROC curve if you have the number of test instances per class, but not from AUC alone.

$\endgroup$
2
  • $\begingroup$ Thanks for your answer! I understand that I need ROC curve shape to approximate exactly. I have number of instances per class and initial ROC curve, and I want to know is there any reason to improve the model (→ AUC) to reach a specific profit (sum of confusion matrix elements with weights). I have an idea to "inflate" the ROC curve, but it does not sounds good. Any ideas in this case? $\endgroup$ Commented Dec 23, 2014 at 15:27
  • 1
    $\begingroup$ For cost-sensitive stuff you might want to read "Basic Principles of ROC Analysis" by Metz and the discussion about iso-performance lines in "An introduction to ROC analysis" by Fawcett. $\endgroup$ Commented Dec 23, 2014 at 16:33

Your Answer

By clicking “Post Your Answer”, you agree to our terms of service and acknowledge you have read our privacy policy.

Not the answer you're looking for? Browse other questions tagged or ask your own question.