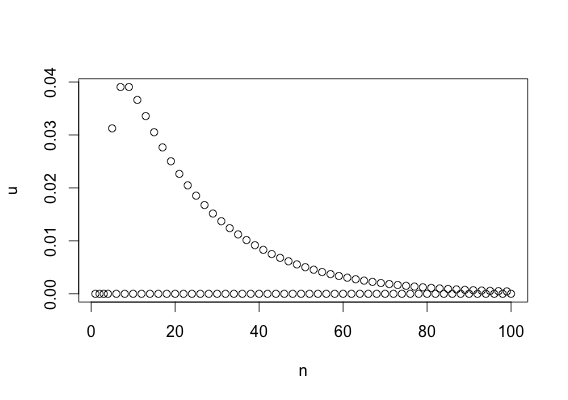
A friend of mine asked the following question, which I haven't found a convincing answer for it yet. I'd appreciate any comment in advance.
The game has two players $A$ and $B$, each having $\$5$ initially. At each round a fair coin is tossed. If it comes up head, $B$ has to give $A$ a dollar, and if tail comes up, $A$ has to give a dollar to $B.$ The game continues until one of them runs out of money and the other one wins.
Now the question is
What's the distribution of number of tosses until one wins and game finishes? (stopping time distribution of the game!)
My thoughts:
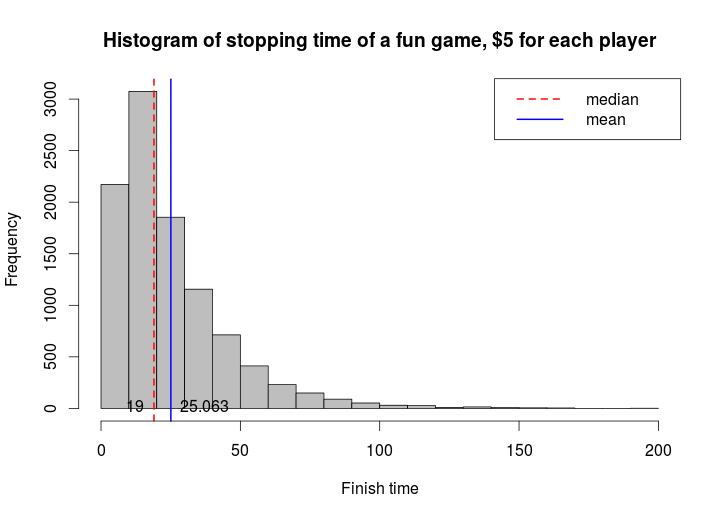
The following is my simulation of $10,000$ games. I first thought, that follows a Poisson distribution with mean $25,$ but its median, if it was Poisson, would be around $25$ as well (precisely, according to Wikipedia, the median $\nu$ should be $25 - \ln 2 < \nu < 25 + 1/3$) which is not the case here.
Now I wonder what that is?
set.seed(123)
funGame <- function(moneyA, moneyB) {
    N <- 0 # number of games to finish
    results <- c(0)
    while((sum(results) != moneyA) && (sum(results) != -moneyB)) {
        results <- c(results,  sample(c(-1, 1), 1, replace=T))
        N <- N + 1
    }
    return(N)
}

moneyA <- 5
moneyB <- 5
nsim <- 10000
nres <- c()
for(n in 1:nsim) nres <- c(nres, funGame(moneyA, moneyB))
hist(nres, breaks=25, col='grey', xlab="Finish time",
 main="Histogram of stopping time of a fun game, $5 for each player")
abline(v=median(nres), col='red', lty=2, lwd=2)
abline(v=mean(nres), col='blue', lty=1, lwd=2)
legend("topright", c("median", "mean"), col=c('red', 'blue'),
   lty=c(2,1), lwd=c(2,2))
text(median(nres), 0, toString(median(nres)) , pos = 2)
text(mean(nres), 0, toString(mean(nres)), pos = 4)


