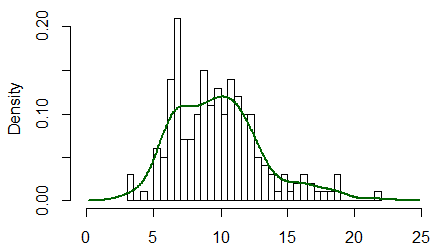
The problem is that a density and the usual frequency (i.e. count) histogram aren't on the same scale (i.e. at heart this isn't an R problem, it's a problem that a count histogram isn't a legitimate density).
Typically, a density has area 1, but a histogram has area $n$. This kind of problem would occur any time you compared things with different area.
[Edit: I was thinking of a histogram like this, where the count is definitely represented by area, but A.Donda is quite right to point out in comments that R's hist doesn't do that*; it represents count by height and so the area is of the histogram will be $n\times$ the binwidth ($b$, say). *(and indeed more generally it's very common that people define the count in relation to the heights of the histogram rather than in terms of area. My desire to call that a bar chart doesn't change what the hist command does, for example). So consequently, in many cases the area will actually be $nb$, as it is here.]
To make them comparable, you will either need to scale your histogram to have area 1 (making the histogram into a density-estimate, the solution I would suggest), or you need to scale your density to have area $n$ (at which point it's no longer a density of course, but is at least something comparable to the frequency histogram).
(An easy way to achieve the first in R is just to use freq=FALSE in your call to hist)
There's an example of the resulting comparison (having the two displays both be valid densities) in this post:


