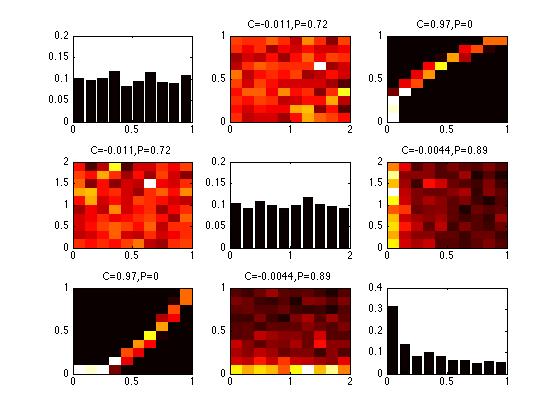
Bivariate histogram matrices give me intuition which categorical variables are related to one another. For example:
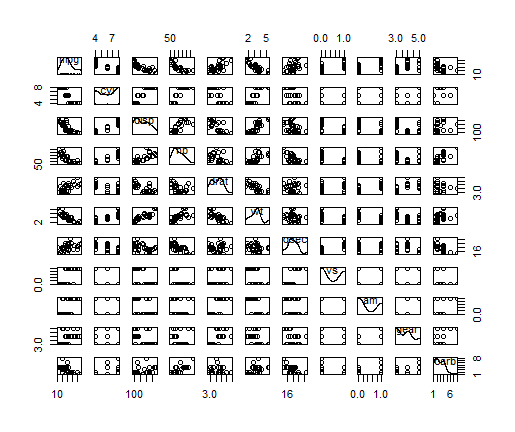
I can easily see which variables are related to one another. Indeed, this graphical device isn't brought up as much as scatter plot matrices. Why not? One point of scatter plot matrices is to infer linear correlations between variables in our dataset.
Scatter plot matrices are only useful for continuous variables. So - bivariate histogram matrices seem to be the best bet for categorical variables.
Are there any disadvantages to this approach? Or do you folks use a different technique for visualizing associations between categorical variables?


