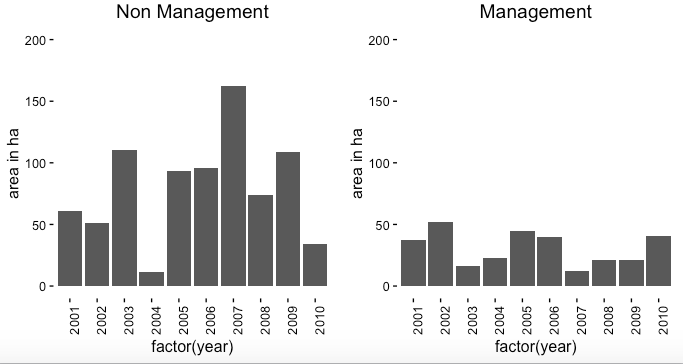
I am monitoring tree death caused by insects and potential impact of human treatment on yearly amount of tree mortality in areas with and without human intervention. My data are recorded by remote sensing, thus my results represents the area of trees killed per year.
Please, is there a way how to evaluate the effect of human intervention? My data contain one observation per year per category intervention/non-intervention. Is this the case of dynamic regression?
Dataset: two areas, differing by management or non-management approaches - one without chemical treatment (A), another with chemical treatment (B). Both contain the area of killed trees in yearly time step.
How can I decide if these two types of management differs, or if one potentially leads to decreased tree mortality? Is there a way how can I include in my analysis the amount of treatment applied each year and its impact in subsequent year? The insects develop within a year, and the treatment is applied by aerial treatment, not on specific tree thus I don't observe the immediate effect on chemical on the insect individual, as the treatment can stay on leafs of bark.
Thank you a lot for your suggestions !
sample data:
library(ggplot2)
library(gridExtra)

set.seed(100)
df<-data.frame(year = c(2001:2010),
               A = floor(runif(10, min=0, max=200)),
               B = floor(runif(10, min=0, max=60)))

a<- ggplot(df, aes(factor(year), y = A)) + ggtitle("Non Management") +
geom_bar(stat = "identity") + ylim(0,200) + ylab("area in ha") +
theme_classic() + theme(axis.text.x = element_text(angle = 90))

b <- ggplot(df, aes(factor(year), y =B)) + ggtitle("Management") +
  geom_bar(stat = "identity") + ylim(0,200) + ylab("area in ha") +
  theme_classic() + theme(axis.text.x = element_text(angle = 90))

grid.arrange(a,b, ncol = 2)

