4
$\begingroup$

GOAL

I am interested in the inverse cumulative distribution function - aka quantile function - my plan is to randomize the distribution using the inverse probability integral transform, aka feeding the inverse cum. distribution function samples from a uniform [0,1] distribution.

WHAT I TRIED SO FAR

I have fit a univariate KDE to a dataset

from statsmodels.nonparametric.api import KDEUnivariate
kde = KDEUnivariate(X.values)
kde.fit()

Now, the guide states that KDE is a function. However, what I get is a np array, which is also fine - happy to interpolate the data myself. However, what I do not get is where those numbers come from.

To begin with, kde.icdf is bigger in size that my sample X.values - suggesting that the lib has imposed somehow an arbitrarily finer grained mesh (in the source code gridsize = len(self.density))

In[88]: kde.icdf
Out[88]: 
array([-0.08641907, -0.08623651, -0.07847717, ...,  0.09789788,
        0.10873394,  0.10898888])

Secondly, I found odd the chart here. I would have expected $icdf: [0,1] \rightarrow X$ where $X$ is the support.

Something like:

import numpy as np
from statsmodels.nonparametric.api import KDEUnivariate
sample_data = np.random.normal(size=1000)
kde = KDEUnivariate(sample_data)
kde.fit()
quantiles_mesh = np.linspace(0,1,len(kde.density))
plt.plot(quantiles_mesh, kde.icdf)

What is the reasoning beyond that chart?

Bottom Line: given my goal I am not sure I am not going in the right direction. How to get there on the path of least resistance?

$\endgroup$
6
  • 1
    $\begingroup$ This seems to mix together some problem in some unstated software and, possibly, a statistical misunderstanding. Questions should be as far as possible self-contained and not depend on reading external links or on people understanding source code in some software. Many details are not clear: what does the function you used do? KDE may mean kernel density estimation but is far from a universal abbreviation. What is an np array? Please consult the Help Center on what questions are on- and off-topic here: questions about specific software without a statistical core are off-topic. $\endgroup$
    – Nick Cox
    Commented Sep 16, 2016 at 11:53
  • $\begingroup$ unstated software -> this q points to statsmodels - code snippets are both in the q and the library has been red'd in the tags. Happy to clarify further. I guess this is really what the question is about - trying to reconcile my understanding of statistical theory with the results I get from the library: I believe it is a fair question and according to the site guidelines. $\endgroup$ Commented Sep 16, 2016 at 11:57
  • $\begingroup$ I think you need to rewrite to make the statistical question central. There is nothing clearly reproducible here. For example, if you supplied a simple dataset and showed the results then people could experiment in almost any software, but if your stance is that this is specifically about statsmodels then this would be better on Stack Overflow so long as you supplied a complete reproducible example. $\endgroup$
    – Nick Cox
    Commented Sep 16, 2016 at 12:00
  • 1
    $\begingroup$ FWIW, a kernel density estimate can't be easily or logically be returned in a vector (variable, column) with the same number of values as the raw data, if only because the distribution is usually taken to extend beyond the minimum and maximum values. The details of what is returned should be documented, naturally. Quite apart from any question of what is on- or off-topic, I don't use this software and regret that I cannot advise on specifics. $\endgroup$
    – Nick Cox
    Commented Sep 16, 2016 at 12:05
  • 2
    $\begingroup$ statsmodels uses by default a FFT for the univariate KDE, so the data needs to be transformed to be on a uniform grid first. The non-FFT version is much slower. $\endgroup$
    – Josef
    Commented Sep 16, 2016 at 14:26

2 Answers 2

2
$\begingroup$

Since you have not given reproducible code (and some of your links are dead), I am going to focus only on the statistical issue here ---i.e., the choice of technique for estimating the quantile function.


Rather than trying to reinvent an existing field of statistics, I would suggest you start by reading some of the existing statistical literature on non-parametric estimation of quantile functions. A good starting point for this would be Sheather and Marron (1990), which reviews and analyses some standard kernel-based quantile estimators (which are a subclass of L-estimators), and also discusses bandwidth estimation for these kernels.

A common non-parametric method due to Parzen (1979) is to take an initial quantile function $\tilde{Q}$ (which is commonly taken to be the empirical quantile function) and a kernel density $K$ and form the corresponding smoothed quantile estimator:

$$\hat{Q}(u) \equiv \frac{1}{h} \int \limits_0^1 Q(p) \cdot K \Big( \frac{u-p}{h} \Big) \ dp.$$

If one takes $\tilde{Q}$ to be the empirical density of the data then we have:

$$\tilde{Q}(p) = \max \Big\{ X_{(i)} \Big| i \leqslant p \cdot n \Big\} = X_{(\lfloor{p \cdot n} \rfloor)},$$

which gives:

$$\begin{equation} \begin{aligned} \hat{Q}(u) &= \frac{1}{h} \int \limits_0^1 X_{(\lfloor{p \cdot n} \rfloor)} \cdot K \Big( \frac{u-p}{h} \Big) \ dp\\[6pt] &= \sum_{i=1}^n \frac{X_{(i)}}{h} \int \limits_{(i-1)/n}^{i/n} K \Big( \frac{u-p}{h} \Big) dp. \\[6pt] \end{aligned} \end{equation}$$

$\endgroup$
0
$\begingroup$

EDIT: (in Python)

import numpy as np
import matplotlib.pyplot as plt
from statsmodels.nonparametric.kde import KDEUnivariate

mu = 0
sigma = 1
data = np.random.normal(mu, sigma, 1000)

S_grid = np.linspace(-5, 5, 100)

kde=KDEUnivariate(data)
kde.fit(kernel='gau',bw='normal_reference')

fig, axs = plt.subplots(2)
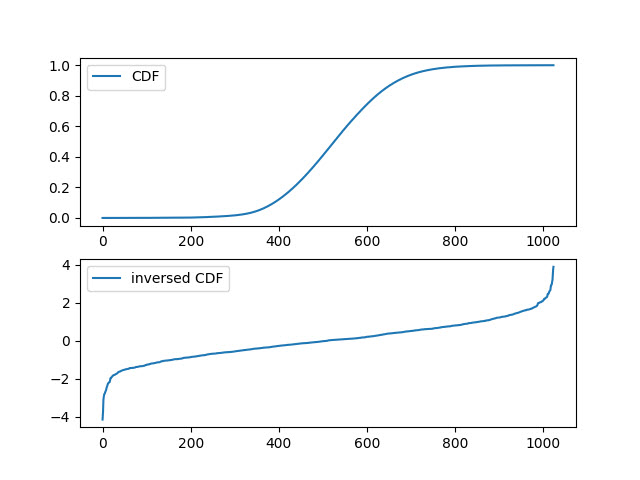
axs[0].plot(kde.cdf, label='CDF')
axs[0].legend()
axs[1].plot(kde.icdf, label='inversed CDF')
axs[1].legend()
plt.show()

density = kde.evaluate(S_grid)    

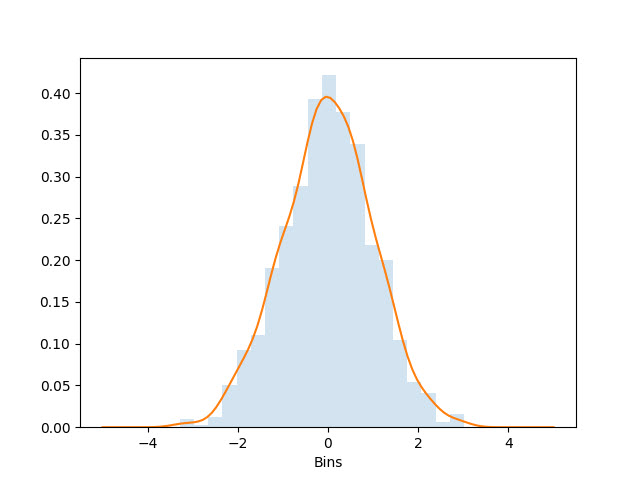
cnts, bins, patches = plt.hist(data.T, bins=20, density=True, label='Histogram', alpha=0.2)

plt.plot(S_grid, density, label='Estimate (bw={:.3g})'.format(kde.bw))
plt.xlabel('Bins')
plt.show()

inversed CDF is used to determine the value of the variable associated with a specific probability.

If you specify a probability p for a distribution with CDF denoted by $F(x; <parameters>)=p$, then the ICDF function returns a quantile q that satisfies F(q;) = p. In other words, $q=F^{-1}(p)$

enter image description here here, given CDF is integral from this PDF enter image description here

you can feed your fitted kde with any sample, like in this code you do it with density = kde.evaluate(S_grid) (sample_grid)

for additional info - - see docs

$\endgroup$
1
  • 7
    $\begingroup$ Although implementation is often mixed with substantive content in questions, we are supposed to be a site for providing information about statistics, machine learning, etc., not code. It can be good to provide code as well, but please elaborate your substantive answer in text for people who don't read this language well enough to recognize & extract the answer from the code. $\endgroup$ Commented May 22, 2018 at 18:45

Your Answer

By clicking “Post Your Answer”, you agree to our terms of service and acknowledge you have read our privacy policy.

Not the answer you're looking for? Browse other questions tagged or ask your own question.