GOAL
I am interested in the inverse cumulative distribution function - aka quantile function - my plan is to randomize the distribution using the inverse probability integral transform, aka feeding the inverse cum. distribution function samples from a uniform [0,1] distribution.
WHAT I TRIED SO FAR
I have fit a univariate KDE to a dataset
from statsmodels.nonparametric.api import KDEUnivariate
kde = KDEUnivariate(X.values)
kde.fit()
Now, the guide states that KDE is a function. However, what I get is a np array, which is also fine - happy to interpolate the data myself. However, what I do not get is where those numbers come from.
To begin with, kde.icdf is bigger in size that my sample X.values - suggesting that the lib has imposed somehow an arbitrarily finer grained mesh (in the source code gridsize = len(self.density))
In[88]: kde.icdf
Out[88]:
array([-0.08641907, -0.08623651, -0.07847717, ...,  0.09789788,
        0.10873394,  0.10898888])
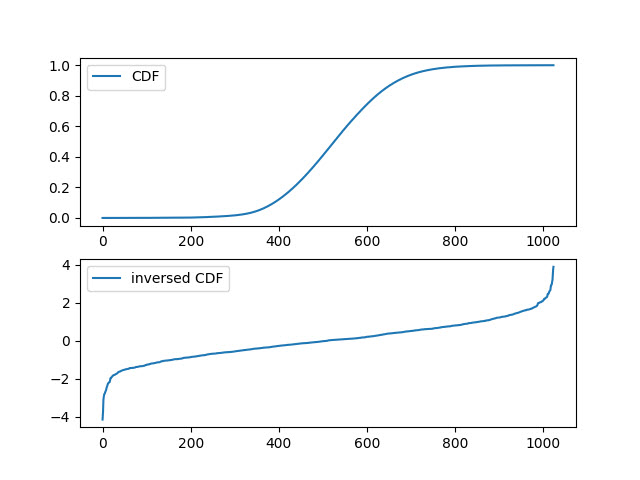
Secondly, I found odd the chart here. I would have expected $icdf: [0,1] \rightarrow X$ where $X$ is the support.
Something like:
import numpy as np
from statsmodels.nonparametric.api import KDEUnivariate
sample_data = np.random.normal(size=1000)
kde = KDEUnivariate(sample_data)
kde.fit()
quantiles_mesh = np.linspace(0,1,len(kde.density))
plt.plot(quantiles_mesh, kde.icdf)
What is the reasoning beyond that chart?
Bottom Line: given my goal I am not sure I am not going in the right direction. How to get there on the path of least resistance?


statsmodels- code snippets are both in the q and the library has been red'd in the tags. Happy to clarify further. I guess this is really what the question is about - trying to reconcile my understanding of statistical theory with the results I get from the library: I believe it is a fair question and according to the site guidelines. $\endgroup$