6
$\begingroup$

Problem

I'm working on a school project in Java and my goal is to detect and remove outliers from a dataset containin geo points.

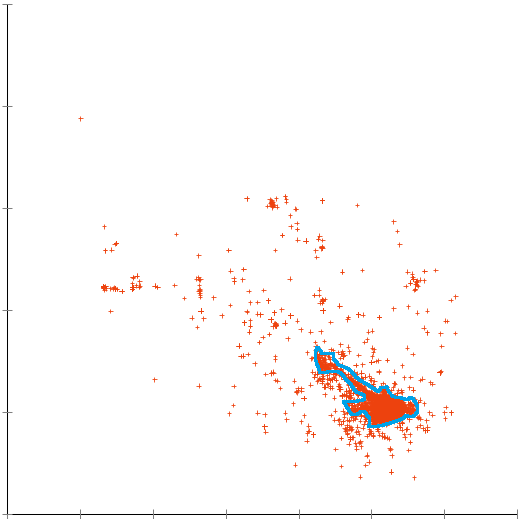
The final result should be a single cluster, with any shape, containing all the points inside a real area (like a stadium for example). Here's a quick example of what I mean:

enter image description here

The hand-drawn blue line represents the expected cluster, while all the outside points should be considered as outliers (this is just one of the possible clusters that can be ok for my case, not detecting the top part is fine too).

What I tried

While DBSCAN looks like the best choice, I need this to be unsupervised so I can't manually set eps and minPts (the algorithm should run on several datasets). What could work is a function that defines both eps and minPts based on the size of the dataset and the size of the area (maybe in meters, using a geo-based distance function), but defining such function can be quite challenging for a small project.

To avoid dealing with eps I decided to try OPTICS but it still requires minPts and, in my tests using ELKI, it returns a single cluster with all the points.

Finally, since ELKI has a lot of builtin algorithms, I also tried LibSVMOneClassOutlierDetection becauseit should be the best option for binary classification (which is my task basically, classes can be seen as "inside" and "outside" the cluster), but it detects almost any point as outlier (even if they have a score, and all the needed points have score < 0.1 so I may do some post-processing steps later).

Question

So, here are the questions:

  1. Is there an unsupervised (and possibly paramterless) algorithm that I can use to solve this task?
  2. If yes, is there any implementation ready somewhere?
  3. Bonus - Can you suggest an algorithm that's already built in ELKI (or even Weka)? If it's in ELKI, can you suggest an evaluation function for the Evaluator if the automatic one is not good enough?

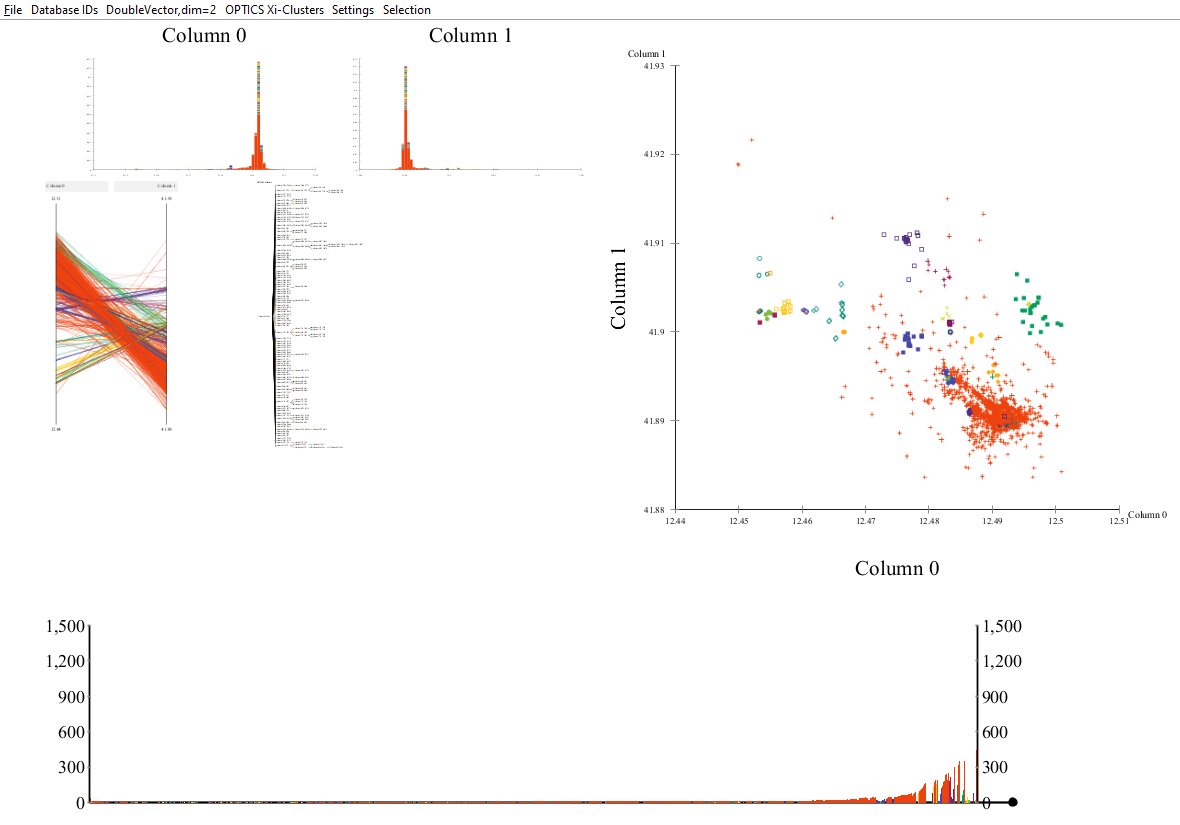
EDIT: Based on suggestions I've tried OPTICSXi with minPts = 50, here's the result.

enter image description here

As you can see, there are two problems:

  1. Red cluster, which is the candidate to be the correct one, contains points that are way far from center, but I suppose that I can deal with them later
  2. There are other clusters inside the red one, while they should be part of it

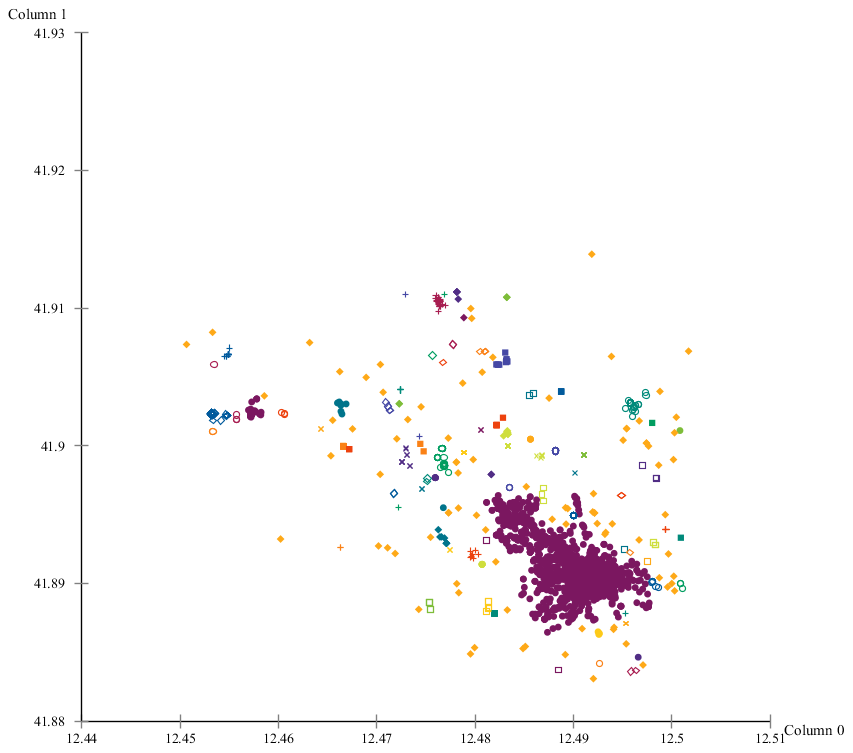
EDIT 2: did some other tests using DBSCAN with an automatic eps estimation and I like the result more than OPTICS' one, but the question now is: how can I extract the purple cluster and remove all the others? I can't seem to find any way to evaluate a DBSCAN cluster based on density.

enter image description here

$\endgroup$
5
  • $\begingroup$ Did you use OPTICSXi? Because just OPTICS will only produce the OPTICS plot, not clusters. Did you try outlier detection such as kNN and LOF? $\endgroup$ Commented Nov 2, 2016 at 21:11
  • $\begingroup$ I can't find anything on OPTICSXi so I don't know how to use the Xi parameter. LOF produces results that are hard to read since each point has a big outlier bubble, and both LOF/kNN require a parameter that I should compute somehow. $\endgroup$
    – StepTNT
    Commented Nov 2, 2016 at 22:23
  • $\begingroup$ It's one of the OPTICS choices in ELKI. It's the one you need to get clusters instead of the plot. Itjs in the OPTICS paper (look out for the Xi character). $\endgroup$ Commented Nov 3, 2016 at 6:17
  • $\begingroup$ The purple cluster is simply the lagest cluster? $\endgroup$ Commented Nov 9, 2016 at 9:03
  • $\begingroup$ It is. Does this mean that I can simply use the number of points to evaluate them? EDIT: I'm not sure that this will be the case with other datasets though. $\endgroup$
    – StepTNT
    Commented Nov 9, 2016 at 9:06

2 Answers 2

2
$\begingroup$

Your task seems to be rather a clustering than an outlier detection task.

In the following, I use this popular data set of User locations (Joensuu).

Running OPTICS with the parameters

-dbc.in /tmp/MopsiLocations2012-Joensuu.txt
-algorithm clustering.optics.OPTICSXi -opticsxi.xi 0.05
-algorithm.distancefunction geo.LngLatDistanceFunction
-optics.epsilon 5000.0 -optics.minpts 50

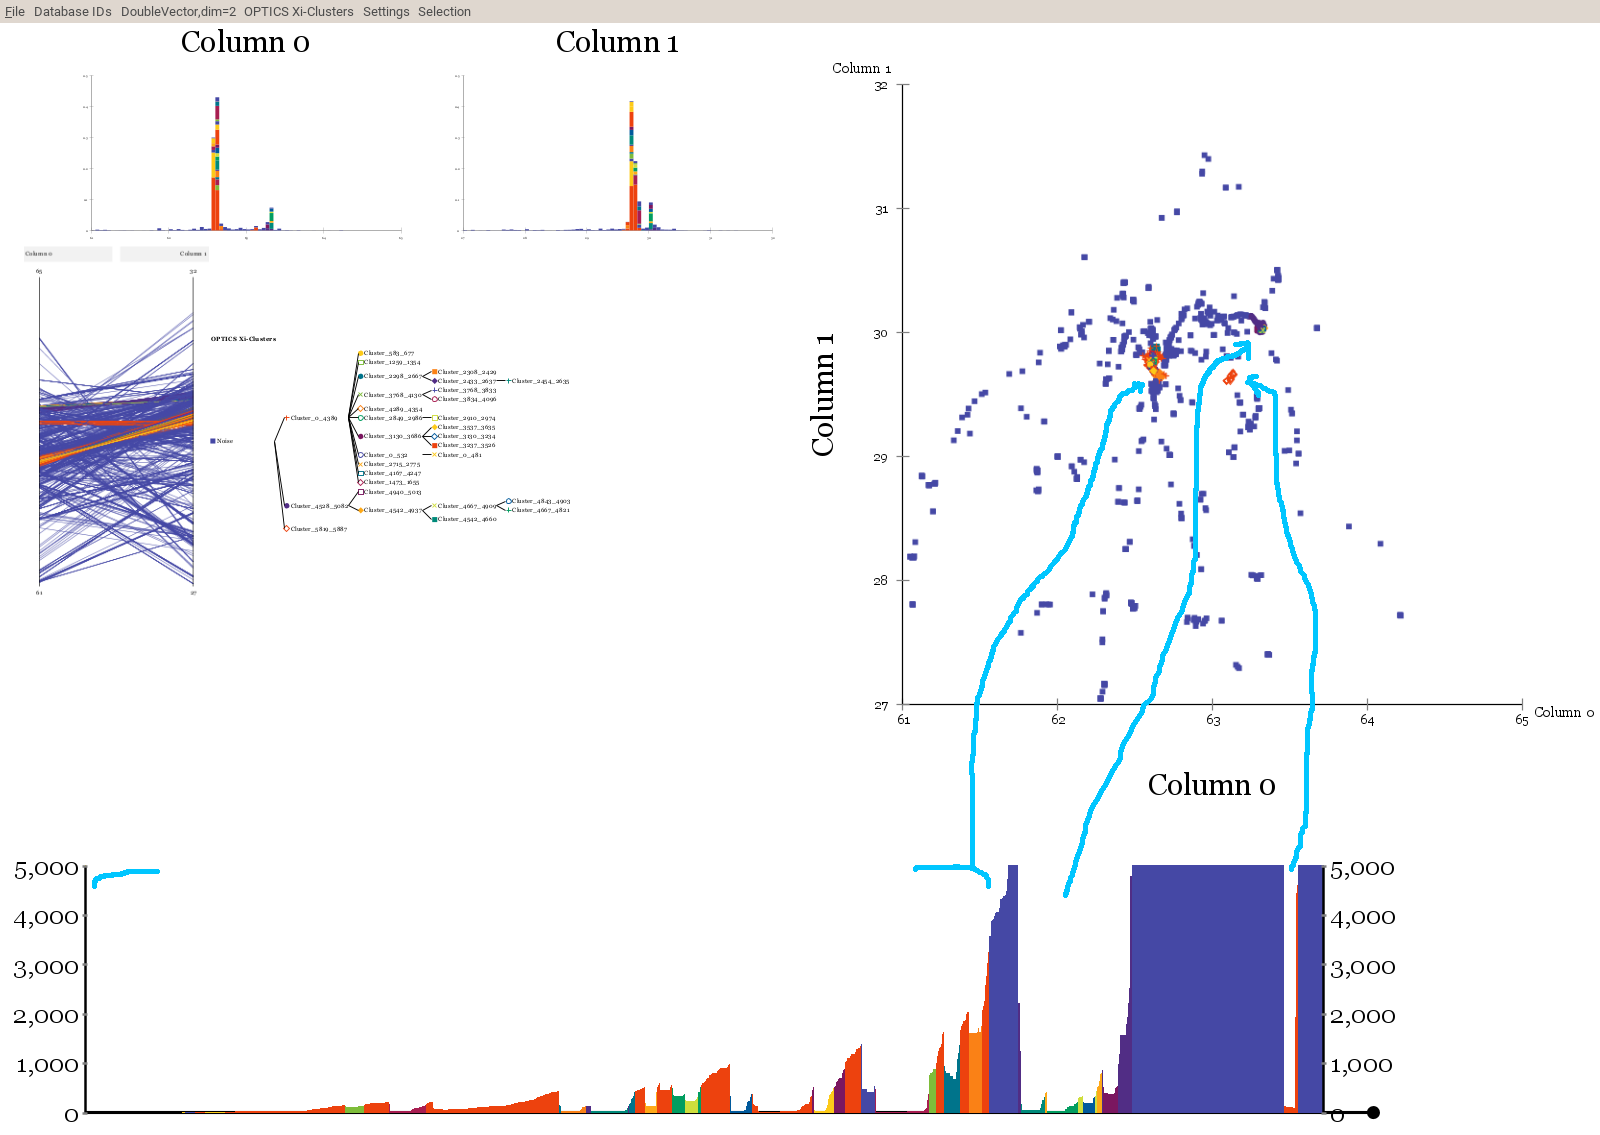
yields the following (hierarchical) clustering. You can see there are three larger clusters (corresponding to Joensuu, Lieska, and Savijärvi; note that the plot has latitude and longitude 'the wrong way'), and some noise (violet here) that is not density-reachable with 5km distance and 50 points. These are your outliers.

You can tell there are some subclusters in both cities. For example one corresponding to the Prisma Joensuu shopping mall. To see more detail, it is helpful to further reduce epsilon, maybe to just 500 meters.

enter image description here

$\endgroup$
7
  • $\begingroup$ Doesn't this solution makes everything supervised? I mean, both epsilon and minPts need to be manually chosen somehow and I need to run this on different datasets, so I can't use any "magic" value. $\endgroup$
    – StepTNT
    Commented Nov 3, 2016 at 10:34
  • $\begingroup$ You need to choose these to suit your problem. It's good to be able to do so. Clustering is an exploratory technique, you want parameters to explore. See e.g. this answer. But depending on your problem, parameters may transfer from one data set to another similar data set. So maybe you can use the same minpts (e.g. 10) for all of your data sets; epsilon is an upper bound to get a nicer plot, you do not need to set it. Xi is relative, so 5% may work for all of them, too. $\endgroup$ Commented Nov 3, 2016 at 12:04
  • $\begingroup$ I know that being able to choose parameters is good, but my assignment requires something that can run without inserting parameters. For example, the image in the OP contains more than 41k points while another dataset has a size of just 2500, so using the same minPts can be quite risky. Since you're the main programmer behind ELKI (and thank you for that software!), do you have any plan on adding TURN*? Because it looks really promising for what I need to do. $\endgroup$
    – StepTNT
    Commented Nov 3, 2016 at 13:44
  • $\begingroup$ We have had an implementation of TURN*, and I also got the original code. But it would not work well for us, it is for pixel data. We never got it work well enough to be worth including. If I remember correctly, the method works on a discrete ("pixels") data model; "left side" neighbor is literally that, the next pixel to the left. Parameter-free clustering is an illusion. For TURN* the essential parameter is the discretization into pixels. $\endgroup$ Commented Nov 3, 2016 at 16:31
  • $\begingroup$ Is there any chance that I can have the original code or the one that you wrote for Elki? I'd like to try it anyways. By the way I just added the results of OPTICSXi to the OP so that you can see why it doesn't look good to me. $\endgroup$
    – StepTNT
    Commented Nov 3, 2016 at 17:12
0
$\begingroup$

To answer Edit 2 of this old question -- one way would be to compute the Mahalanobis distance for each point to the center of the cluster, then delete those above a certain cutoff distance.

$\endgroup$
1
  • $\begingroup$ This could be done, but it's not optimal. It assumes the true cluster distribution is elliptically shaped (which is not true here), & the existence of outliers will affect the Mahalanobis distances of the points. $\endgroup$ Commented May 29, 2021 at 17:35

Your Answer

By clicking “Post Your Answer”, you agree to our terms of service and acknowledge you have read our privacy policy.

Not the answer you're looking for? Browse other questions tagged or ask your own question.