6
$\begingroup$

I have analysed several dimensions in a survey. Each part of the survey represents a theoretical dimension and is analysed with factorial analysis.

I want to use scores from factor analysis to do a classification.

  1. The first factors represents a large part of the variance. Can I keep only first factor or do I need to retain all factors?

  2. After factor analysis, I did a PROMAX rotation which is an oblique rotation. How should I use the output from the PROMAX rotation? If I have taken account of that how do I compute distance with factors correlations matrix?

$\endgroup$
3
  • $\begingroup$ Could you confirm that "classification" is not meant as "cluster analysis" (which is called classification in French), that is do you really seek to apply a supervised method following your FA? $\endgroup$
    – chl
    Commented Oct 13, 2010 at 13:59
  • 1
    $\begingroup$ Yes i think to cluster analysis rather than classifcation. $\endgroup$
    – pbneau
    Commented Oct 14, 2010 at 9:55
  • $\begingroup$ What software did you use to do FA? $\endgroup$ Commented Feb 27, 2011 at 8:39

3 Answers 3

4
$\begingroup$

One solution to your 1. question is to use cross-validation. You compute classification accuracy for models with different number of components and then pick one with the highest classification accuracy. You can check the references below:

PLS Dimension Reduction for Classification with Microarray Data

Rasch-based high-dimensionality data reduction and class prediction with applications to microarray gene expression data

To my experience factor rotation does not improve classification accuracy. Please report your results.

$\endgroup$
4
  • $\begingroup$ I'll come back with results. $\endgroup$
    – pbneau
    Commented Sep 8, 2010 at 15:18
  • $\begingroup$ Do you know of any papers comparing scores computed based on PLS-DA or PLS-1/2 with regression scores coming from a factor model (which account for measurement errors)? $\endgroup$
    – chl
    Commented Sep 8, 2010 at 18:42
  • 1
    $\begingroup$ Sorry for delay. You might find useful the paper "Importance of data structure in comparing two dimension reduction methods for classification of microarray gene expression data" from Caroline Truntzer (BMC Bioinformatics). Actually, it is not about factor model, but PCA model. $\endgroup$
    – Andrej
    Commented Sep 9, 2010 at 8:17
  • $\begingroup$ Thx, I will look at that paper. $\endgroup$
    – chl
    Commented Sep 9, 2010 at 20:52
8
$\begingroup$

Caution: I'm assuming that when you said "classification", you are rather referring to cluster analysis (as understood in French), that is an unsupervised method for allocating individuals in homogeneous groups without any prior information/label. It's not obvious to me how class membership might come into play in your question.

I'll take a different perspective from the other answers and suggest you to try to do a data reduction (through PCA) of your $p$ variables followed by a mix of Ward's hierarchical and k-means clustering (this is called mixed clustering in the French literature, the basic idea is that HC is combined to a weighted k-means to consolidate the partition) on the first two or three factorial axes. This was proposed by Ludovic Lebart et coll. and is actually implemented in the FactoClass package.

The advantages are as follows:

  • If any part of your survey is not clearly unidimensional, you will be able to gauge item contribution to the second axis, and this may help to flag those items for further inspection;
  • Clustering is done on the PCA scores (or you can work with a multiple correspondence analysis, though in the case of binary items it amounts to yield the same results than a scaled PCA), and thanks to the mixed clustering the resulting partition is more stable and allow to spot potential extreme respondents; you can also introduce supplementary variable (like gender, SES or age), which is useful to inspect between-group homogeneity.

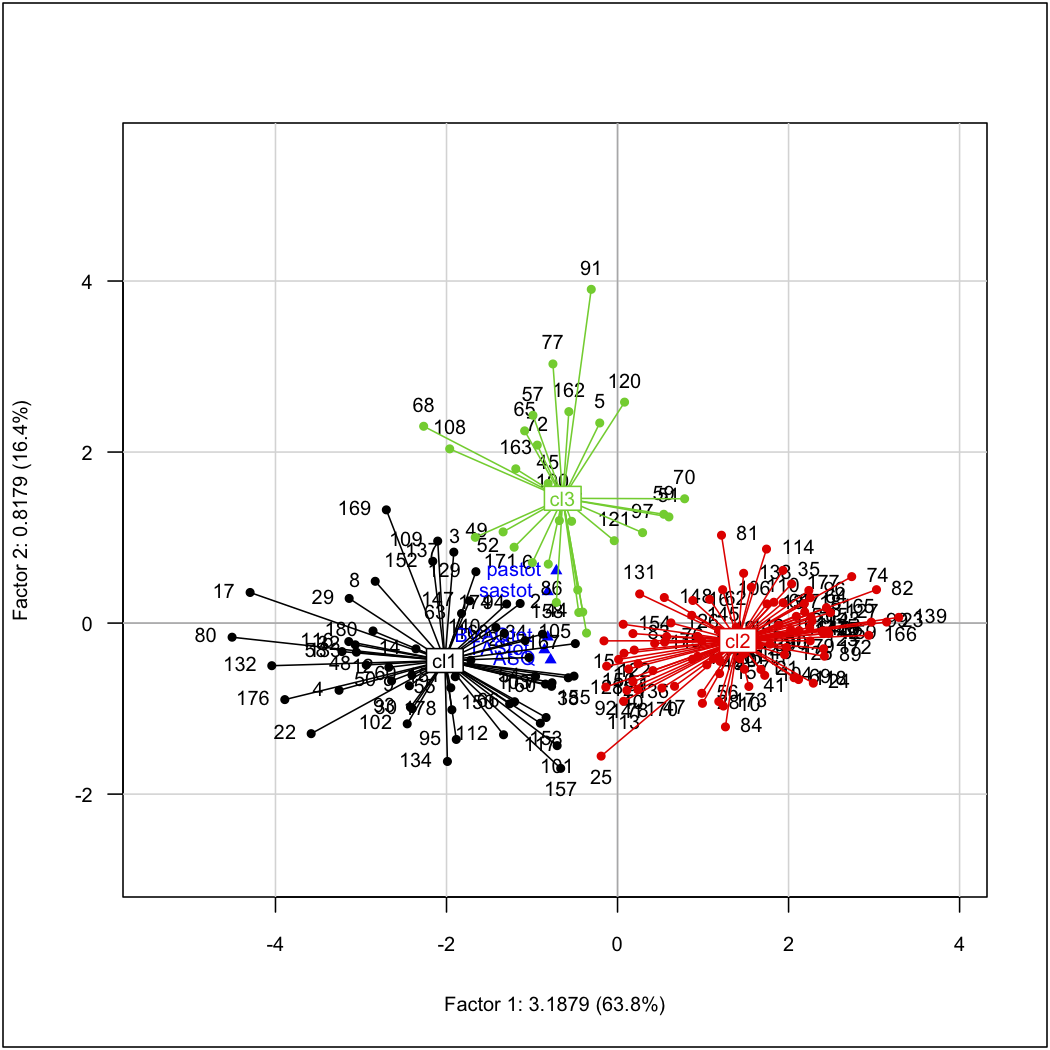
In this case, no rotation is supposed to be applied to the principal axes. Considering a subspace with q < p allows to remove random fluctuations which often make the variance in the p - q remaining axes. This can be viewed as some kind of "smoothing" on the data. Instead of PCA, as I said, you can use Multiple Correspondence Analysis (MCA), which is basically a non-linear PCA where numerical scores are assigned to respondents and modalities of dummy-coded variables. I have had some success using this method in characterizing clinical subgroups assessed on a wide range testing battery for neuropsychological impairment, and this generally yields results that are more or less comparable (wrt. interpretation) to model-based clustering (aka latent trait analysis, in the psychometric literature). The FactoClass package relies on ade4 for the factorial methods, and allows to visualize clusters in the factorial space, as shown below:
alt text

Now, the problem with so-called tandem approach is that there is no guarantee that the low-dimensional representation that is produced by PCA or MCA will be an optimal representation for identifying cluster structures. This is nicely discussed in Hwang et al. (2006), but I'm not aware of any implementation of the algorithm they proposed. Basically, the idea is to combine MCA and k-means in a single step, which amounts to minimize two criteria simultaneously (the standard homeogeneity criterion and the residual SS).

References

  1. Lebart, L, Morineau, A, and Piron, M (2000). Statistique exploratoire multidimensionnelle (3rd ed.). Dunod.
  2. Hwang, H, Dillon, WR, and Takane, Y (2006). An extension of multiple correspondence analysis for identifying heterogeneous subgroups of respondents. Psychometrika, 71, 161-171.
$\endgroup$
1
  • 1
    $\begingroup$ The MCAk function in Angelos Markos' clustrd R package implements Hwang et al. (2006)'s algorithm. Some other notable solutions to the tandem problem are also implemented in the same package. $\endgroup$
    – fmark
    Commented Jul 6, 2016 at 4:12
2
$\begingroup$

One approach that side-steps cross-validation to determine the optimal number of factors is to use the nonparametric Bayesian approaches for factor analysis. These approaches let the number of factors to be unbounded and eventually decided by the data. See this paper that uses such an approach for classification based on factor analysis.

$\endgroup$
1
  • $\begingroup$ Thanks for your answer and reference. I will check differents models and do cross validation. Bayesian is a good idea. $\endgroup$
    – pbneau
    Commented Sep 8, 2010 at 15:19

Your Answer

By clicking “Post Your Answer”, you agree to our terms of service and acknowledge you have read our privacy policy.

Not the answer you're looking for? Browse other questions tagged or ask your own question.