I have a dataset with a large number of Yes/No responses. Can I use principal components (PCA) or any other data reduction analyses (such as factor analysis) for this type of data? Please advise how I go about doing this using SPSS.
-
1$\begingroup$ What made you consider PCA specifically as oppose to discriminant analysis? $\endgroup$– Chris SimokatCommented Oct 2, 2011 at 19:07
-
1$\begingroup$ See also: stats.stackexchange.com/a/186026/3277 $\endgroup$– ttnphnsCommented Dec 10, 2015 at 8:37
1 Answer
The question of dichotomous or binary variables in PCA or Factor analysis is eternal. There are polar opinions from "it is illegal" to "it is alright", through something like "you may do it but you'll get too many factors". My own current opinion is as follows. First, I deem that binary observed variable is descrete and that it is improper to treat it in any way as continuous. Can this discrete variable give rise to factor or principal component?
Factor analysis (FA). Factor by definition is a continuous latent that load observable variables (1, 2). Consequently, the latter cannot be but continuous (or interval, more practically speaking) when enough loaded by factor. Also, FA, due to its linear regressional nature, assumes that the rest - not loaded - part, called uniqness, is continuous either, and so it comes that observable variables should be continuous even when loaded slightly. Thus, binary variables cannot legislate themselves in FA. However, there are at least two ways round: (A) Assume the dichotomies as roughened continues underlying variables and do FA with tetrachoric - rather than Pearson - correlations; (B) Assume that factor loads a dichotomous variable not linealrly but logistically and do Latent Trait Analysis (aka Item Response Theory) instead of linear FA. Read more.
Principal Component Analysis (PCA). While having much in common with FA, PCA is not a modeling but only a summarizing method. Components do not load variables in the same conceptual sense as factors load variables. In PCA, components load variables and variables load components. This symmetry is because PCA per se is merely a rotation of variables-axes in space. Binary variables won't provide true continuity for a component by their own selves - since they are not continuous, but the pseudocontinuity can be provided by the angle of PCA-rotation which can appear any. Thus in PCA, and in contrast with FA, you can get seemingly continuous dimensions (rotated axes) with purely binary variables (unrotated axes) - angle is the cause of continuity$^1$.
It is debatable whether it is legal to compute mean for binary variables (if you take them as truly categorical features). Usually PCA is performed on covariances or correlations, which implies putting the pivot point of PCA-rotation in the (1) centroid (arithmetic mean). For binary data, it makes sense to consider, besides that, other and more natural for binary data locations for such pivot point, or origin: (2) no-attribute point
(0,0)(if you treat your variables as "ordinal" binary), (3) L1 or Manhattan medoid point, (4) multivariate mode point$^2$.
Some related questions about FA or PCA of binary data: 1, 2, 3, 4, 5, 6. Answers there potentially may express opinions different from mine.
$^1$ Component scores computed in PCA of binary data, like object scores computed in MCA (multiple correspondence analysis) of nominal data, are just fractional coordinates for the granular data in a smooth Euclidean space mapping: these do not permit us to conclude that the categorical data have acquired authentic scale measurement through plain PCA. To have truly scale values, variables must be scale nature from the beginning, at input, or they must be specially quantified or assumed to have been binned (see). But in classic PCA or MCA the room for "continuity" emerges later on the level of summary statistics (such as association or frequency matrices) due to that countability is akin to measurability, both are "quantitative". And for that level entities - for variables as points or categories as points - their coordinates in the principal axes space are legitimately scale values indeed. But not for data points (data cases) of binary data, - their "scores" are pseudocontinuous values: not intrinsic measure, just some overlay coordinates.
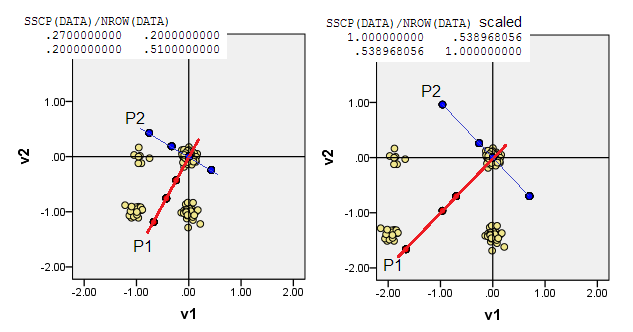
$^2$ Demonstration of various versions of PCA with binary data depending on the location of the origin of rotation. Linear PCA can be applied to any SSCP-type association matrix; it is your choice where to put the origin and whether scale the magnitudes (the matrix diagonal elements) to same value (say, $1$) or not. PCA assumes the matrix is SSCP-type and maximizes, by principal components, SS deviations from the origin. Of course, for binary data (which are bounded) SS deviations depend merely on the frequency observed in this or that direction beyond the origin; yet it also depend on where we locate the origin.
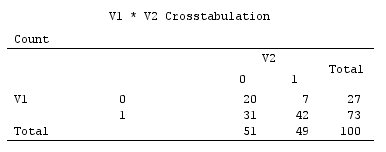
Example of binary data (just a simple case of two variables):
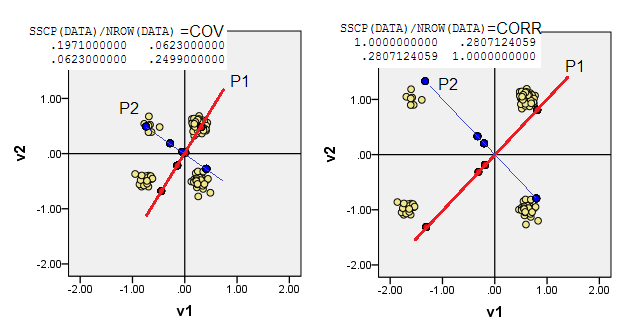
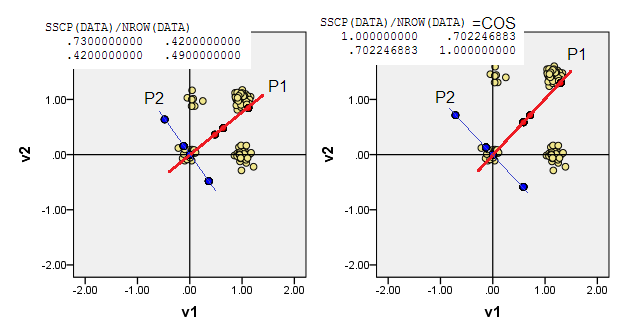
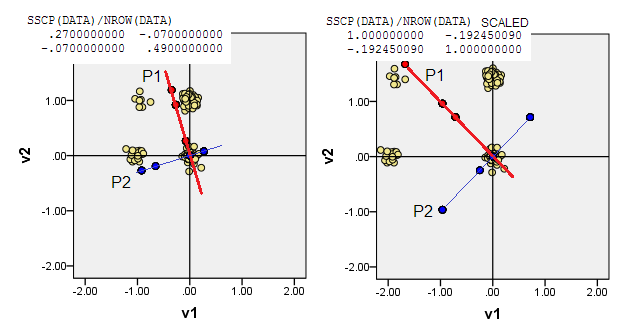
Scatterplots below display the data points a bit jittered (to render frequency) and show principal component axes as diagonal lines bearing component scores on them [those scores, according to my claim are pseudocontinuous values]. The left plot on every picture demonstrates PCA based on "raw" deviations from the origin, while the right plot demonstrates PCA based on scaled (diagonal = unit) deviations from it.
1) Traditional PCA puts the (0,0) origin into data mean (centroid). For binary data, mean is not a possible data value. It is, however, physical centre of gravity. PCA maximizes variability about it.
(Do not forget, too, that in a binary varible mean and variance are strictly tied together, they are, so to speak, "one thing". Standardizing/scaling binary variables, that is, doing PCA based on correlations not covariances, in the current instance, will mean that you impede more balanced variables - having greater variance - to influence the PCA greater than more skewed variables do.)
2) You may do PCA in noncentered data, i.e. let the origin (0,0) go to location (0,0). It is PCA on MSCP (X'X/n) matrix or on cosine similarity matrix. PCA maximizes protuberability from the no-attribute state.
3) You may let the origin (0,0) lie at the data point of the smallest sum of Manhattan distances from it to all the other data points - L1 medoid. Medoid, generally, is understood as the most "representative" or "typical" data point. Hence, PCA will maximize atypicality (in addition to frequency). In our data, L1 medoid fell on (1,0) original coordinates.
4) Or put the origin (0,0) at the data coordinates where the frequency is the highest - multivariate mode. It is the (1,1) data cell in our example. PCA will maximize (be driven by) junior modes.
5) In the answer's body it was mentioned that tetrachoric correlations is a sound matter to perform factor analysis on, for binary variables. Same could be said about PCA: you may do PCA based on tetrachoric correlations. However, that means you are supposing an underlying continuous variable within a binary variable.
-
3$\begingroup$ About the connection between FA on binary items and IRT models (1- and 2-PL), here are two articles that might be interesting: Takane & de Leeuw, On the relationship between item response theory and factor analysis of discretized variables, Psychometrika (1987) 52(3):393; and a more recent one, Kamata & Bauer, A Note on the Relation Between Factor Analytic and Item Response Theory Models, SEM (2008) 15:136. $\endgroup$– chlCommented Dec 9, 2011 at 13:18

