1
$\begingroup$

I'm trying to filter a time series, of which I occasionally can observe the state variable variable but not always. I also have a noisy measure of this state variable all the time. By picking the time points when I have both, I can compute the error between the two, which gives me a sense of what the noisy measure is like.

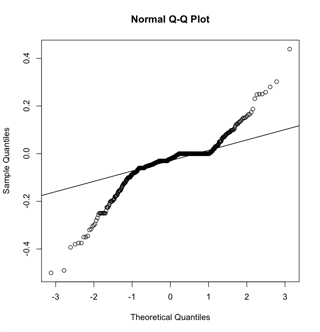
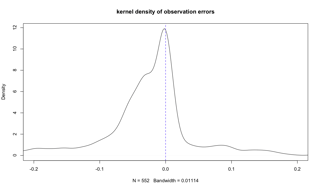
enter image description hereenter image description here

The distribution of error seems to be both skewed and fat-tailed. Based on my rudimentary understanding of Kalman filter, this type of error process would violate the the assumption of normally distributed errors, and using just mean and variance would be biased because the first two moments of the probability distribution are not suffice to characterize the whole thing. I have two questions.

(1) if I don't have other good approaches for now and insist on using Kalman filter, what risk am I taking? Or in other words, how does this kind of distribution affect the accuracy of Kalman filter.

(2) Since the parameters of the measurement equation has to be estimated as well (both coefficients and error variance), I was thinking about using Box-Cox transformation to fix the skew and fit it to a t-distribution. Can I then estimate the parameters online using MLE of t-distribution.

$\endgroup$
2
  • $\begingroup$ "of which I occasionally can observe the state variable variable but not always." I suspect your model is mis-specified, and in some other way than in which you suggest (normality instead of t-errors). The 'state' process in a linear gaussian state space model can represent many different things, but one thing that it may not be is partially or sometimes observed. I suggest talking more about the specifics of your data to get it sorted out $\endgroup$
    – Taylor
    Commented Jan 11, 2017 at 16:48
  • $\begingroup$ @Taylor I know it may sound absurd in theory but in reality this could happen. Suppose people trade some kind of security and we are trying to obtain the price continuously. Occasionally a trade happens, and we believe that we observe that "price" at that moment. Other times, people quote the price that want to buy or sell at, no trade happens. This can be regarded as a noisy measure of the price. $\endgroup$
    – Will Gu
    Commented Jan 11, 2017 at 17:13

1 Answer 1

1
$\begingroup$

The definition of a state space model is a hidden/unobserved markov chain $x_t$, and observed data $y_t$. I don't know if you can go breaking the rules so early on like that. First hunch: try a model like this for each security. It might accomplish what you want to accomplish, while not breaking the rule that states have to be hidden.

$$ y_t = c + x_t + v_t $$ $$ x_t = x_{t-1} + w_t $$ where $y_t \in \mathbf{R}^3$, $x_t \in \mathbf{R}^1$, $w_t \overset{iid}{\sim} \text{Normal}(0, Q)$, $v_t \overset{iid}{\sim} \text{Normal}(0, R)$.

At regularly sampled intervals $$ \left[ \begin{array}{c} y_{1,t}\\ y_{2,t} \\ y_{3,t} \end{array}\right] = \left[ \begin{array}{c} ask_t\\ execution_t \\ bid_t \end{array}\right] $$ and $c = (\epsilon/2, 0, -\epsilon/2)$ so $\epsilon$ is the bid-ask spread. Finally $$ R = \left[ \begin{array}{ccc} r_{1,1} & 0 & 0\\ 0 & r_{2,2} & 0 \\ 0 & 0 & r_{3,3} \end{array}\right] $$ so you would expect $r_{2,2}$ to be equal to or atleast very close to $0$, and the other two you might constrain to be the same. Anyway the parameters you would have to estimate would be $(c, R, Q)$, which is do-able.

Also, nowhere am I saying that the state is observable. But I am kind of working around that by saying $y_{2,t} = x_t + \{\text{very little noise}\}$, and we're thinking about $x_t$ as the 'true' price (you kind of have to defend your interpretation of 'true' here).

Then do diagnostics on the residuals of this model. You will probably have better looking ones. Just a guess, though. I don't work in this domain. If it's still a problem you can make $v_t$ have fatter tails.

Possible extensions:

  1. Let $c$ change overtime (call it $c_t$)
  2. Sample at irregularly sampled intervals
  3. better state dynamics.
  4. model multiple securities all at once
  5. Let the variances be stochastic or maybe just changing deterministically in time
  6. Executions happen on the NBBO, which means sometimes $y_{1,t} = y_{2,t}$ which doesn't jive with your choice of $c$. So $c_t$ might even need to be switching or something.
$\endgroup$
6
  • $\begingroup$ Thank you for your thorough answer. That's exactly what I'm doing but now I'm more confident about my approach (and thank you for that too). My question was exactly around what you said "the parameters you would have to estimate would be $(c,R,Q)$, which is do-able" -- How would you estimate these parameters? I thought about regression model but as we discussed in another post, the $x$ is supposed to be unknown. I'm by no means an expert in stats, but is this another domain to I would need to study deeply before raising any more questions? $\endgroup$
    – Will Gu
    Commented Jan 11, 2017 at 22:16
  • $\begingroup$ @WillGu that relates to the last question I answered of yours. It seems like I've been promoting this book a lot lately, but chapter 6 of springer.com/us/book/9781441978646 has a section detailing estimaton of state space models with maximum likelihood and EM, and it gives a whole lot of readable R code $\endgroup$
    – Taylor
    Commented Jan 11, 2017 at 22:21
  • $\begingroup$ Thank you. I'll definitely read through that book. I think I was confused about the mismatch between my data residuals and the normality assumption of Kalman filter. Is it correct that I can tackle this problem from both ways: either improve my model to get normally distributed residuals, or estimate the parameters using different MLE functions based on my assumption on the residual distributions (e.g. use MLE for t-distribution if I assume the error is t-distributed)? $\endgroup$
    – Will Gu
    Commented Jan 11, 2017 at 22:33
  • $\begingroup$ Saying 'residuals' implies that they are coming from a model. Your initial model was assuming that your differences are iid mean zero normal. You basically fit this model when you started looking at the residuals. It's such a simple model, so you never had to run any hill-climbing software. If this model was correct, then your residuals should've looked better. And as you have mentioned, they don't look very good. So the model probably isn't correct. I am simply suggesting a different model. $\endgroup$
    – Taylor
    Commented Jan 11, 2017 at 22:48
  • $\begingroup$ A thing that I think is common especially with people looking at financial data is complaining of 'non-normality,' which isn't a valid complaint without specifying the entire model. It doesn't make any sense, but it's something people do all the time. The 'true' model might indeed involve normal distributions, but in a complicated way. $\endgroup$
    – Taylor
    Commented Jan 11, 2017 at 22:48

Your Answer

By clicking “Post Your Answer”, you agree to our terms of service and acknowledge you have read our privacy policy.

Not the answer you're looking for? Browse other questions tagged or ask your own question.