3
$\begingroup$

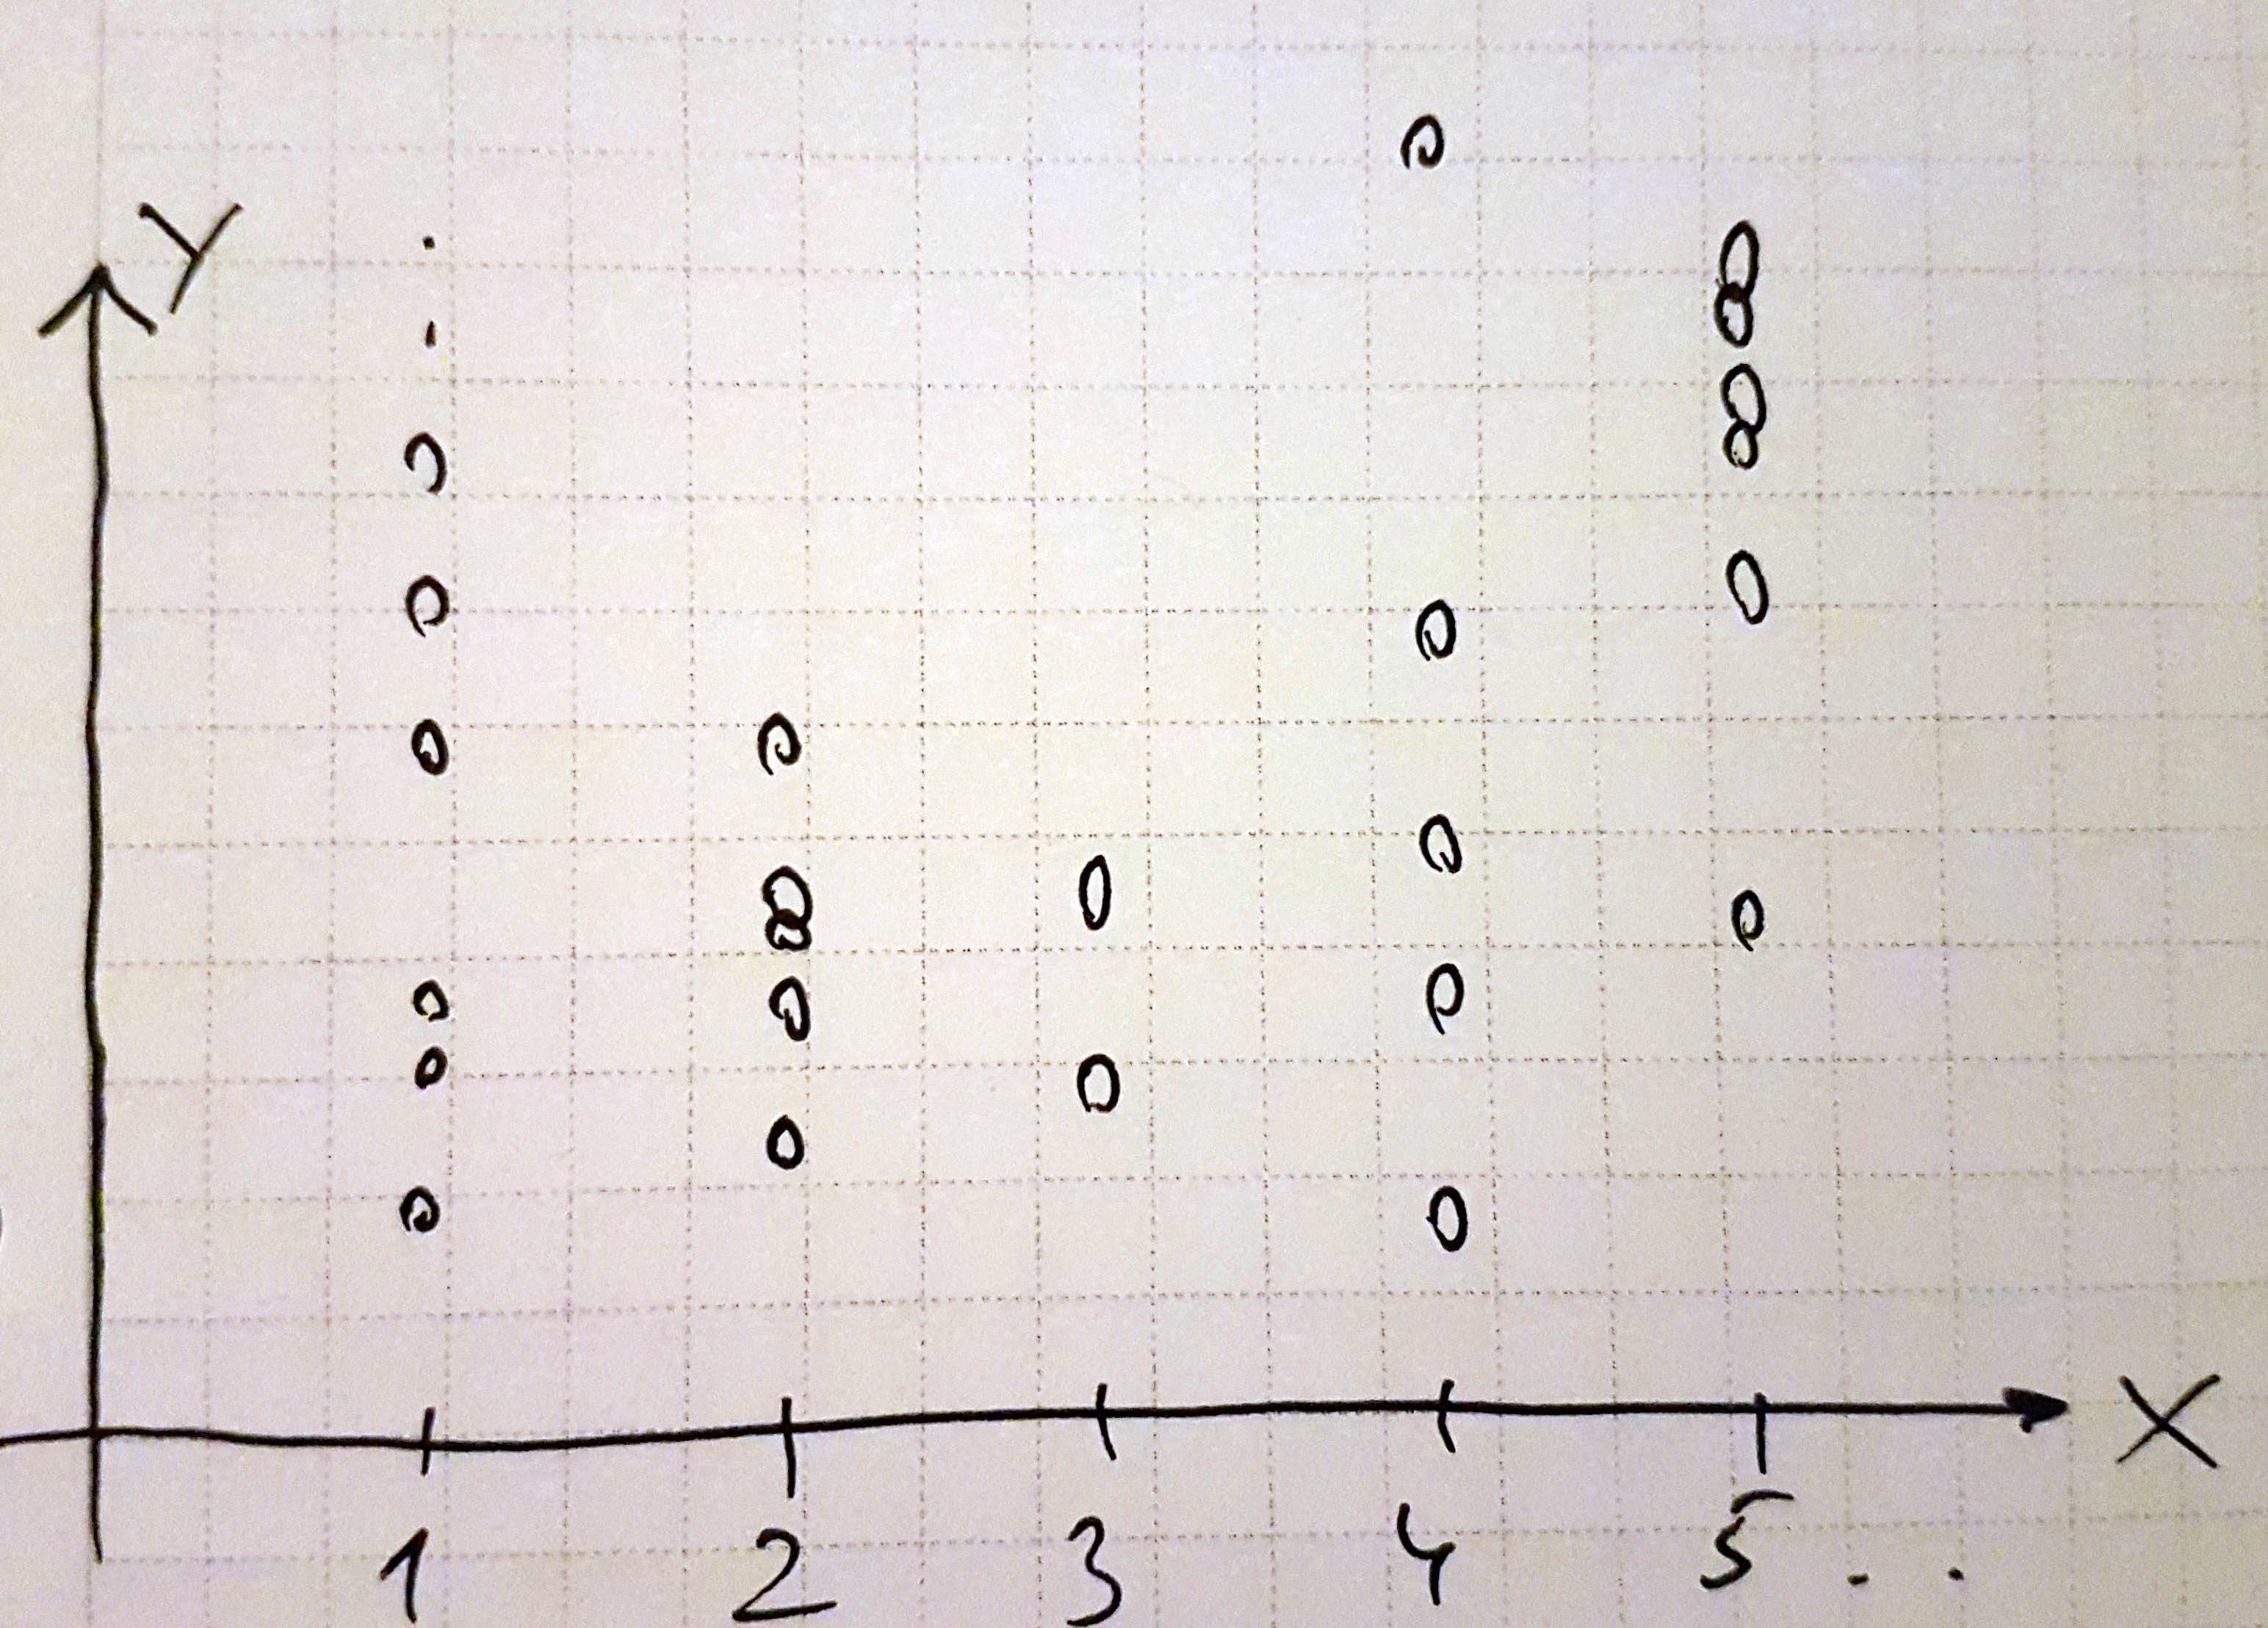
I would like to compute a correlation between observed values of X and Y, but the data is such that the values of X are discrete (and few), and with an equal number of data points for each value of X, as illustrated below.

enter image description here

This seems to me violate the (I believe, default) assumption for a function to only have one value of Y at every value of X. I know this applies to continuous functions and not to discrete observations, but even so the nature of this data (multiple y values for a given x) seems to not lend itself well to a simple correlation such as Pearson's R.

The problem seems to be mitigated by simply reversing the positions of X and Y on the axes, but the data makes more sense with X on the abscissa.

What would be an appropriate measure of the correlation between X and Y?

$\endgroup$
2
  • 1
    $\begingroup$ The "one value of Y for every value of X" problem is a common problem in regression-type applications. However, since there's clearly variation in $Y$ at any given value of $X$, it's not $Y$ itself that is seen as being in a functional relationship to $X$ but some aspect of the conditional distribution of $Y$, such as its conditional mean so $E(Y|X)$ can have a functional relationship with $X$, for example. I don't think that's in any way different for your problem. There's nothing really wrong with a Pearson correlation for discrete data if you expect the relationship ...ctd $\endgroup$
    – Glen_b
    Commented Feb 19, 2017 at 4:25
  • 1
    $\begingroup$ ctd.,,. between $E(Y|X)$ and $X$ to be well-described by a linear relationship. However, for a $Y$ variable consisting of counts other ways of describing the relationship are more common (specifically, GLMs are often used, which, depending on the nature of the count variable will look at various possible curvilinear relationships (specifically where a transformed $E(Y|X)$ is seen as linear in $X$ $\endgroup$
    – Glen_b
    Commented Feb 19, 2017 at 4:26

1 Answer 1

1
$\begingroup$

Spearman's correlation coefficient would be technically more applicable than Pearson's, since X is better described as ordinal than as continuous. Still, chances are both methods will produce very similar results. The assumption you describe as pertaining to functions is not a standard assumption underlying either of these methods of assessing correlation.

But why do you want to settle for an indicator of linear association? These data show a U- or at least a J-shaped relationship. This might be assessed via ANOVA, where X is treated as a nominal variable; via regression splines (see threads on this site); or via the addition of a squared term to a linear regression.

$\endgroup$

Your Answer

By clicking “Post Your Answer”, you agree to our terms of service and acknowledge you have read our privacy policy.

Not the answer you're looking for? Browse other questions tagged or ask your own question.