25
$\begingroup$

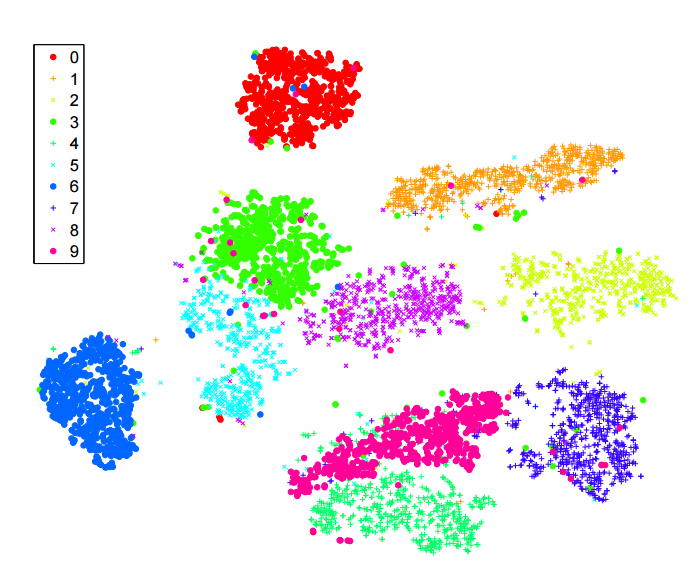
I've been reading a lot about $t$-sne algorithm for dimensionality reduction. I'm very impressed with the performance on "classic" datasets, like MNIST, where it achieves a clear separation of the digits (see original article):

t-SNE MNIST

I've also used it to visualize the features learnt by a neural network I'm training and I was very pleased with the results.

So, as I understand it:

$t$-sne has good results on most datasets, and has a pretty efficient implementation - $O(n \log n)$ with the Barnes-Hut approximation method. Then, could we potentially say that the "dimensionality reduction" problem, at least for the purpose of creating good 2D/3D visualizations, is now a "closed" problem?

I'm aware that this is a pretty bold statement. I'm interested in understanding what the potential "pitfalls" of this method are. That is, are there any cases in which we know that it is not useful? Moreover, what are the "open" problems in this field?

$\endgroup$
0

3 Answers 3

18
$\begingroup$

Definitely not.

I agree that t-SNE is an amazing algorithm that works extremely well and that was a real breakthrough at the time. However:

  • it does have serious shortcomings;
  • some of the shortcomings must be solvable;
  • there already are algorithms that perform noticeably better in some cases;
  • many t-SNE's properties are still poorly understood.

Somebody linked to this very popular account of some shortcomings of t-SNE: https://distill.pub/2016/misread-tsne/ (+1), but it only discusses very simple toy datasets and I find that it does not correspond very well to the problems that one faces in practice when working with t-SNE and related algorithms on real-world data. For example:

  1. t-SNE often fails to preserve global structure of the dataset;
  2. t-SNE tends to suffer from "overcrowding" when $N$ grows above ~100k;
  3. Barnes-Hut runtime is too slow for large $N$.

I will briefly discuss all three below.


  1. t-SNE often fails to preserve global structure of the dataset.

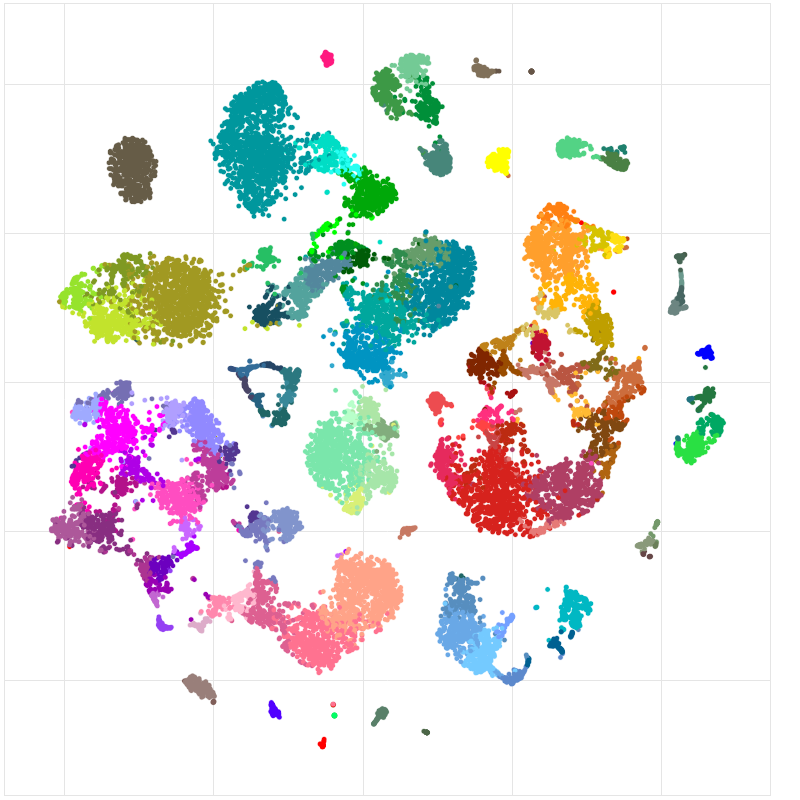
    Consider this single cell RNA-seq dataset from the Allen institute (mouse cortical cells): http://celltypes.brain-map.org/rnaseq/mouse. It has ~23k cells. We know a priori that this dataset has a lot of meaningful hierarchical structure, and this is confirmed by hierarchical clustering. There are neurons and non-neural cells (glia, astrocytes, etc.). Among neurons, there are excitatory and inhibitory neurons -- two very different groups. Among e.g. inhibitory neurons, there are several major groups: Pvalb-expressing, SSt-expressing, VIP-expressing. In any of these groups, there seem to be multiple further clusters. This is reflected in the hierarchical clustering tree. But here is t-SNE, taken from the link above:

    enter image description here

    Non-neural cells are in grey/brown/black. Excitatory neurons are in blue/teal/green. Inhibitory neurons are in orange/red/purple. One would want these major groups to stick together, but this does not happen: once t-SNE separates a group into several clusters, they can end up being positioned arbitrarily. The hierarchical structure of the dataset is lost.

    I think this should be a solvable problem, but I am not aware of any good principled developments, despite some recent work in this direction (including my own).

  2. t-SNE tends to suffer from "overcrowding" when $N$ grows above ~100k

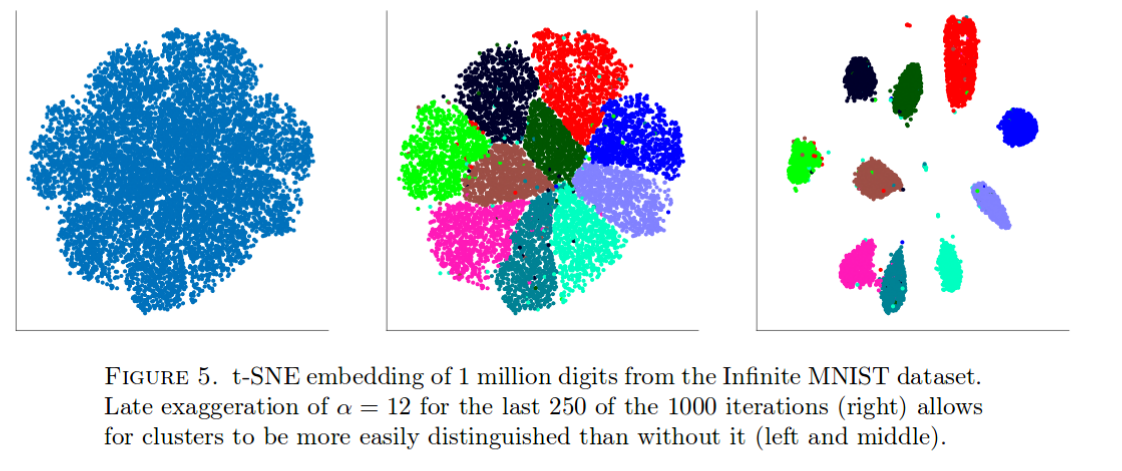
    t-SNE works very well on the MNIST data. But consider this (taken from this paper):

    enter image description here

    With 1 mln data points, all clusters get clumped together (the exact reason for this is not very clear) and the only known way to counter-balance is with some dirty hacks as shown above. I know from experience that this happens with other similarly large datasets as well.

    One can arguably see this with MNIST itself (N=70k). Take a look:

    enter image description here

    On the right is t-SNE. On the left is UMAP, a new exciting method under active development, that is very similar to an older largeVis. UMAP/largeVis pull clusters much further apart. The exact reason for this is IMHO unclear; I would say there is still a lot to understand here, and possibly a lot to improve.

  3. Barnes-Hut runtime is too slow for large $N$

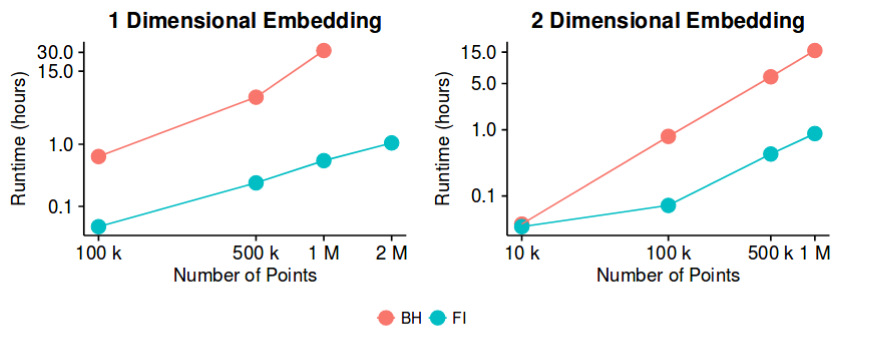
    Vanilla t-SNE is unusable for $N$ over ~10k. The standard solution until recently was Barnes-Hut t-SNE, however for $N$ closer to ~1mln it becomes painfully slow. This is one of the big selling points of UMAP, but actually a recent paper suggested FFT-accelerated t-SNE (FIt-SNE) that works much faster than Barnes-Hut t-SNE and is at least as fast as UMAP. I recommend everybody to use this implementation from now on.

    enter image description here

    So this might not exactly be an open problem anymore, but it used to be until very recently, and I guess there is room for further improvements in runtime. So work can certainly continue in this direction.

$\endgroup$
0
8
$\begingroup$

I would still love to hear other comments but I'll post my own answer for now, as I see it. While I was looking for a more "practical" answer, there are two theoretical "dis-advantages" to t-sne which are worth mentioning; the first one is less problematic, and the second should definitely be considered:

  1. t-sne cost function is not convex, so we are not guaranteed to reach a global optimum: Other dimensionality reduction techniques (Isomap, LLE) have a convex cost function. In t-sne this is not the case, hence there are some optimization parameters that need to be effectively tuned in order to reach a "good" solution. However, although a potential theoretical pitfall, it's worth mentioning that in practice this is hardly a downfall, since it seems that even the "local minimum" of the t-sne algorithm outperforms (creates better visualizations) then the global minimum of the other methods.

  2. curse of intrinstic dimensionality: One important thing to keep in mind when using t-sne is that it is essentially a manifold learning algorithm. Essentially, this means t-sne (and other such methods) are designed to work in situations in which the original high dimensional is only artificially high: there is an intrinsic lower dimension to the data. i.e, the data "sits" on a lower dimensional manifold. A nice example to have in mind is consecutive photos of the same person: While I might represent each image in the number of pixels (high-dimension), the intrinstic dimensionality of the data is actually bounded by the physical transformation of the points (in this case, the 3D rotation of the head). In such cases t-sne works well. But in cases where the intrinsic dimensionality is high, or the data points sit on a highly varying manifold, t-sne is expected to perform badly, since it's most basic assumption - local linearity on the manifold - is violated.

For the practical user, I think this implies two useful suggestions to bear in mind:

  1. Before performing dimensionality reduction for visualization methods, always try to first figure out if there actually exists a lower intrinsic dimension to the data you're dealing with.

  2. If you're not sure about 1 (and also generally), it might be useful, as the original article suggests, to "perform t-sne on a data representation obtained from a model that represents the highly varying data manifold efficiently in a number of nonlinear layers, such as an auto-encoder". So the combination of auto-encoder + t-sne can be a good solution in such cases.

$\endgroup$
2
  • $\begingroup$ Hi @galoosh33! I am wondering if you already had a chance to take a look at my answer. Was it helpful? I have no idea if you are still interested in this 1.5 years after asking this question, so I'd appreciate some feedback... In your own accepted answer you say that you would still love to hear further thoughts, but this also was some time ago :) $\endgroup$
    – amoeba
    Commented Aug 29, 2018 at 21:10
  • 1
    $\begingroup$ thanks for your great answer @amoeba! I will review it this weekend. $\endgroup$
    – galoosh33
    Commented Sep 4, 2018 at 7:00
7
$\begingroup$

Here's an excellent analysis of how varying the parameters when running t-SNE affects some very simple datasets: http://distill.pub/2016/misread-tsne/. In general, t-SNE seems to do well at recognizing high-dimensional structures (including relationships more complex than clusters), though this is subject to parameter tuning, especially perplexity values.

$\endgroup$

Your Answer

By clicking “Post Your Answer”, you agree to our terms of service and acknowledge you have read our privacy policy.

Not the answer you're looking for? Browse other questions tagged or ask your own question.