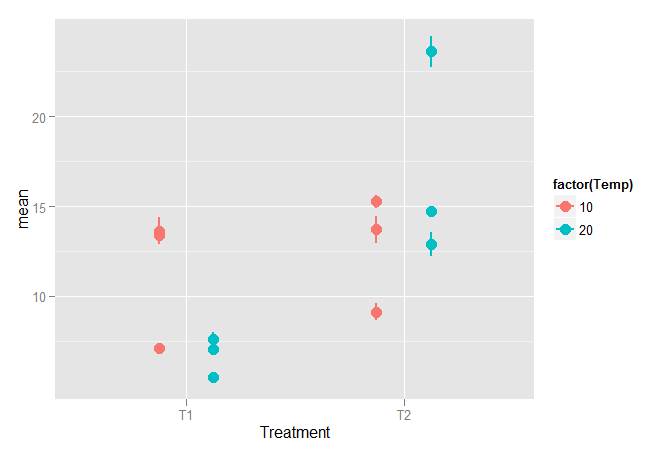
This is continuation for a series of questions (1, 2). I have a data set from an experiment with 2x2 design. A replicate consists of 20-50 normally distributed replicate measurements. Each treatment combination has 3 of these replicates. Measured average response for each replicate seems not to be normally distributed.
 Figure 1. Example of the problem. Error bars show standard error of mean.
Since this is an experiment and I am supposed to talk about an effect of a treatment, I would like to combine the variation within measurements (error bars) and between replicates (dots in the figure) into one number / treatment combination and use the error bars with one mean value to show the overall effect of a treatment (a dot instead of three). Ideally I would like to use confidence intervals of some sort (asked here). I have understood that since this is an unbalanced nested design, I should use mixed models or a simple 2-way ANOVA for mean values, but how to compress the variation on two levels into one figure?
Would the delta method be something for me?
R code with an example of the data:
library(ggplot2)

x1 <- c(rnorm(50, 14,3),rnorm(35, 7,1),rnorm(40, 15,9))
x2 <- c(rnorm(43, 6,3),rnorm(32, 7,1),rnorm(40, 8,4))
x3 <- c(rnorm(50, 15,5), rnorm(50, 10,7), rnorm(50, 13,9))
x4 <- c(rnorm(26, 14,2), rnorm(43, 25,10), rnorm(45, 15,9))

dx1 <- data.frame(Treatment = rep("T1", length(x1)), Temp = rep(10, length(x1)), Rep = rep(c(1,2,3), times = c(50,35,40)), Meas = x1)
dx2 <- data.frame(Treatment = rep("T1", length(x2)), Temp = rep(20, length(x2)), Rep = rep(c(4,5,6), times = c(43,32,40)), Meas = x2)
dx3 <- data.frame(Treatment = rep("T2", length(x3)), Temp = rep(10, length(x3)), Rep = rep(c(7,8,9), times = c(50,50,50)), Meas = x3)
dx4 <- data.frame(Treatment = rep("T2", length(x4)), Temp = rep(20, length(x4)), Rep = rep(c(10,11,12), times = c(26,43,45)), Meas = x4)

# Entire data set

dat <- rbind(dx1,dx2,dx3,dx4)

# Plot overview

w <- ggplot(dat, aes(x = factor(Rep), y = Meas))
w + geom_boxplot(aes(fill = factor(Temp)))

# Averages (with se)

aveg <- aggregate(Meas ~ Treatment + Temp + Rep, data = dat, FUN = mean)
se <- function(x) sd(x)/sqrt(length(x))
SE <- aggregate(Meas ~ Treatment + Temp + Rep, data = dat, FUN = se)

dat2 <- merge(aveg, SE, by = c("Treatment", "Temp", "Rep"), sort = F)

colnames(dat2)[colnames(dat2) %in% grep("\\.x", colnames(dat2), value = T)] <- "mean"
colnames(dat2)[colnames(dat2) %in% grep("\\.y", colnames(dat2), value = T)] <- "se"

# Plot entire data set

p <- ggplot(dat2, aes(x = Treatment, y = mean, ymax = mean + se/2,
ymin = mean - se/2))

p + geom_pointrange(aes(color = factor(Temp)),
position=position_dodge(width=0.50), size = 1)
