1
$\begingroup$

I recently read about a package, which I believe had a name like "tabstat" or "tablestats" which produced a really useful plot of univariate distributions of multiple variables for large datasets. I believe this package was developed by google, but am not sure. I can't seem to find it anywhere (tabstat on google returns a lot of results).

If I'm completely crazy, and this package doesn't exist, what are some good packages for explore really huge datasets? I know plyr has some methods for binning 2D scatterplots to reduce overplotting, but I don't know of any other good packages for visually summarize huge datasets.

$\endgroup$
1

2 Answers 2

1
$\begingroup$

There are a number of approaches and packages to solve this type of question, here is one particular approach that may be effective: http://bridgewater.wordpress.com/2011/07/25/91/

You can also find a broader set of distribution presentation options here http://cran.r-project.org/web/views/Distributions.html

$\endgroup$
2
$\begingroup$

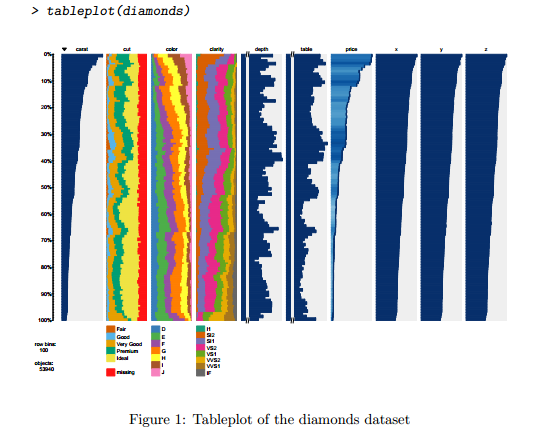
The package I was looking for was tabplot

diamonds

$\endgroup$
2
  • $\begingroup$ Note to self: this is distinct from the similarly-named package 'tableplot' $\endgroup$ Commented Oct 29, 2015 at 3:30
  • $\begingroup$ @digitgopher I've been confused by that one too. It doesn't help that the main function of tabplot is "tableplot..." $\endgroup$
    – Zach
    Commented Oct 29, 2015 at 13:54

Your Answer

By clicking “Post Your Answer”, you agree to our terms of service and acknowledge you have read our privacy policy.

Not the answer you're looking for? Browse other questions tagged or ask your own question.