6
$\begingroup$

This is Statistics 101, but I'm not a statistician and so can't seem to find the right technical jargon to google.

My company collects data at discrete points through time. Today's datapoint is positioned somewhat differently to the others, and so we're having a debate about whether this is an accident of chance or indicative of an actual underlying effect. What side you're on depends on how you eyeball the data, but we need to be able to detect these going forward. It is essentially a question of threshold placement.

"Given a set of datapoints through time, how different does a given datapoint have to be before it can be considered anomalous?", and "How unlikely is a given deviant point to have occurred simply by chance?"

Is this a simple question of outliers or standard deviations? Does the question require some kind of model-fitting to be solvable? I was originally thinking in terms of p-values and hypotheses here - as in, assuming a null hypothesis that the suspect datapoint is just a product of chance, could we calculate the probability of this null hypothesis being true in light of the data?

I don't even need a complete answer here, just pointers in the right direction. There must be a better way to decide these things than eyeballing.

$\endgroup$
5
  • $\begingroup$ In your second to last paragraph, according to standard hypothesis testing logic, you would want to assume a null hypothesis that the suspect datapoint is not an outlier, but is a product of the same underlying data generating process. Note that this requires a model of the DGP, and that moreover this is a big, & common, topic w/i time series analysis. I will let others on CV, who have more expertise in this area than I do, answer your question more fully from here. $\endgroup$ Commented May 22, 2012 at 17:45
  • $\begingroup$ Thankyou, you've clarified a lot. I wonder though if the time element of this is overstated, therefore making the time series analysis aspect a red-herring? I don't think our data varies significantly as a function of time (that is, there aren't meaningful time-based variations to model). If this sounds hard to believe, let us for the sake of argument replace time on the x-axis with another, non-temporal variable. Let us also assume it is the entire population and not a sample. I need to a) identify a grouping or pattern in this population, and b) identify those that deviate significantly. $\endgroup$
    – benxyzzy
    Commented May 22, 2012 at 18:13
  • $\begingroup$ I am not good at this sort of thing - but my thinking is that statistical tests is done on averages... So the question is wether any number belongs to the same distribution as the other numbers in the sample... But the tails of the distribution are in priciple indefinitely long. So any extreme number can pop up... You have to decide on a 'rule of thumb' I think. E.g. the boxplot rule where an outlier is a number more than 1.5 times +/- the interquatile range. $\endgroup$
    – Andreas
    Commented May 22, 2012 at 19:22
  • $\begingroup$ I think you need to have a validated time series model for the data prior to the outlier as @MichaelChernick notes. If it's really true that there are no time-based variations, then your final model will be a flat line, although that's hard for me to believe. Furthermore, if what you have is the entire population then statistical testing, or even calling any observation an 'outlier', makes no sense. If that is your population, then that is your population--that's the whole of the story; statements about 'significance' or 'outliers' are unintelligible. $\endgroup$ Commented May 22, 2012 at 22:52
  • 1
    $\begingroup$ @Andreas Statistical tests are done on averages/expectations. Your rule of thumb is a little bit too loose and can easily be tightened up by Michael Chernick's commentary and Gung's reflections. It is time that statistical rigor be incorporated rather than ignored. $\endgroup$
    – IrishStat
    Commented May 24, 2012 at 18:24

2 Answers 2

10
$\begingroup$

Outlier detection in time series encompasses a large body of literature. First you would want to have a time series model that fit well to the data when there were no suspect observations. If for example an ARMA model works you might assume that the noise distribution is Gaussian. There are at least two types of outliers. Fox defined them in a 1972 paper. The best source to start with on this subject is the latest edition of Barnett and Lewis' "Outliers in Statistical Data" published by Wiley. They have a chapter on time series. My 1982 paper with Downing took the approach of looking at influence functions for autocorrwlation. Our idea is that if an observation had a big effect on one of more of the lagged correlations it would also affect the model parameters adversely. Martin, Yohai and others defined influence functionals for time series in a different way that seems to have better theoretical justification but addresses the same issue . Ruel Tsay, George Tiao and others have also published work on outliers in time series. I am less familiar with that. But our colleague IrishStat can probably comment on that and more. In the process of improving his autobox software over the years IrishStat and his son Tom have invested time into keeping up on the literature about outliers and level shifts (sometimes called interventions) in order to make their product state-of-the-art. Just like with outliers in data that are not time dependent any outliers that are detected using time series methods should be studied to see why they occurred. Were they measurement errors? Maybe a change in the behavior of the process? Maybe a temporary intervention (like the Federal Reserve changing interest rates as an example)? The reason if it can be found will dictate how the outlier should be treated.

$\endgroup$
1
  • $\begingroup$ This is a lot to digest, thanks a lot! I guess it really is a time-series based problem, and I will need a model as a starting point. $\endgroup$
    – benxyzzy
    Commented May 22, 2012 at 19:19
3
$\begingroup$

I'm going to say something that's a bit down at the simpler end, in case you end up drowning in ARMA models (although that of course it the correct way to go).

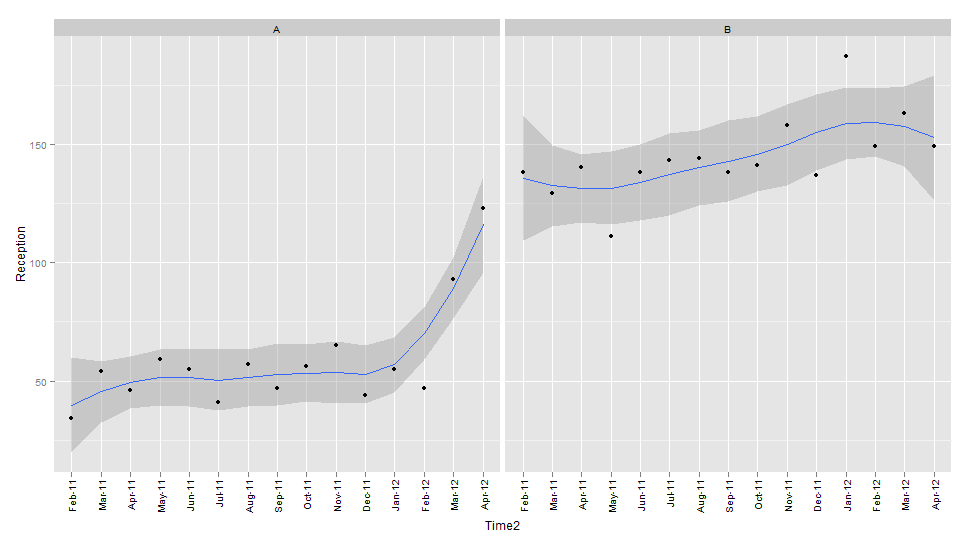
A graph with a fitted line and some measure of variability on could improve your eyeballing. I drew this graph yesterday:

enter image description here

Using this code with ggplot2 in R:

ggplot(mydata, aes(x=Time2, y=Reception, group=1)) + geom_smooth() +
facet_wrap(~Prison) + opts(axis.text.x=theme_text(angle=90, hjust=1)) + geom_point()

There's loads of default options for the smoothing etc., so you don't have to use it out of the box like I have, you can set it up much more nicely than this. But you can see a couple of "outliers" (I use that word loosely) in Prison B straight away.

Or the forecast package in R is very useful too.

As I say, this is more the quick and dirty approach so caveat emptor and all that.

$\endgroup$
4
  • $\begingroup$ Chris, As you say this is quick and dirty. perhaps too quick and too dirty ! Consider a time series 1,9,1,9,1,9,1,9,5 ... the anomalous data point ( the "5" ) would fall "safely" within your bands ... so much for quick 'n dirty . Inliers like outliers left untreated can lead to bad but quick conclusions. Additionally your bands are flawed by the assumption of normality of the residuals around the expectation AND bythe anomalous data points themselves as the inflate the bands thus potentially masking themselves.The whole idea of goods statistical process is to help the eye not hinder the eye $\endgroup$
    – IrishStat
    Commented May 24, 2012 at 18:12
  • $\begingroup$ In fairness, if you drew a graph of 1,9,1,9,1,9,5 then you would quite naturally ignore the smoothing area, it would be totally obvious that the 5 was anomalous. As for assuming normality of residuals, although this isn't tested explicitly you can see that some points are above and below each line and a minority are a long way from the line. The analysis I have presented, IMHO, improves on the "just looking" analysis that the OP is already using. Clearly ARMA would be even better, but not if the OP doesn't have the time or ability to fit ARMA models. $\endgroup$ Commented May 25, 2012 at 10:28
  • $\begingroup$ When you have time series data you have auto-correlated data. When you have auto-correlated data you have a standard deviation that is biased. When you have standard deviation that is biased it does not always reveal the anomalies be they pulses , level shifts, seasonal pulses and/or local time trends that may exist in the error process. Your approach may have some value in some cases to detect pulses but in time series there are three other possible violations regarding the mean of the errors i.e. level/step shifts, seasonal pulses and local time trends. $\endgroup$
    – IrishStat
    Commented May 25, 2012 at 10:55
  • $\begingroup$ Touche. Fair points all. $\endgroup$ Commented May 25, 2012 at 21:55

Your Answer

By clicking “Post Your Answer”, you agree to our terms of service and acknowledge you have read our privacy policy.

Not the answer you're looking for? Browse other questions tagged or ask your own question.